Check Your Understanding So Far
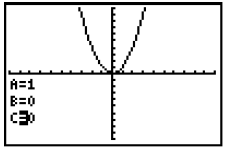
The graph of y = x2 is shown at the right. The
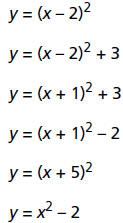
following equations are vertical and horizontal
translations of y = x2. Use what you have learned
about translation of the vertex of a quadratic
function to determine the vertex of the graph of
each equation below. Check your answer using
the Transformation Graphing App. |
 |
 |
Vertex: ________________________ |
| Vertex: ________________________ |
| Vertex: ________________________ |
| Vertex: ________________________ |
| Vertex: ________________________ |
| Vertex: ________________________ |
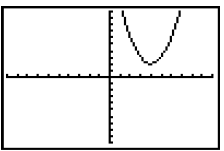
What is the most likely equation of the parabola
( quadratic function ) graphed at the right?
Note: The scale is 1.
_________________________________________________
|
 |
Studying the Effect of A
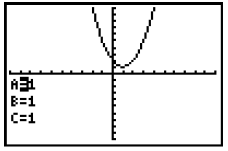
1. Return to the Transformation Graphing App
screen, and press  until the A= is until the A= is
highlighted. |
 |
| |
2. Use the same discovery method you used with B and C to
investigate the effect
of A on the graph of the parabola. Be sure to let A be both negative and
positive .
3. Deactivate the Transformation Graphing App before continuing.
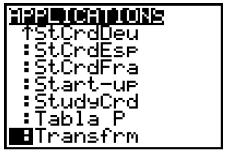
a. Press
 and select Transfrm. and select Transfrm. |
 |
| |
| |
|
| b. Select
Uninstall. |
 |
| |
Question for Discussion
1. What effect does changing the value of A have on the graph ? Be sure to
discuss
both magnitude and sign change (positive and negative values).
_________________________________________________________________________
_________________________________________________________________________
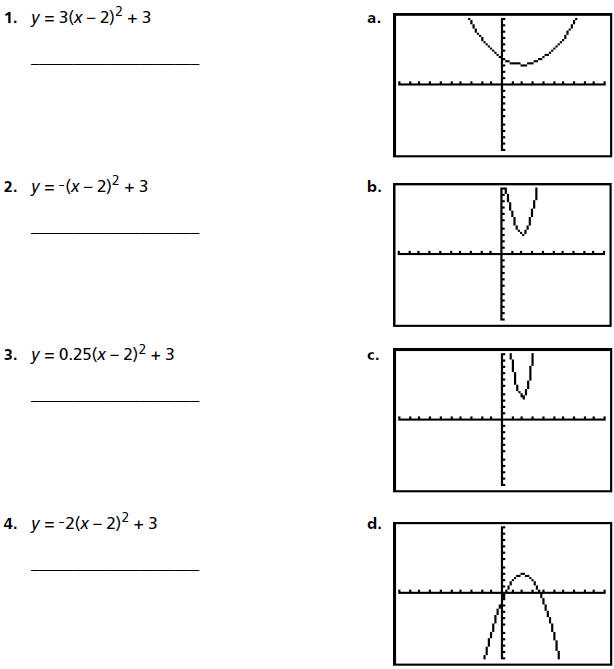
Check Your Understanding
Match each equation from items 1–5 with its graph in column 2. Be sure to look
at
all the equations and compare them before you answer any questions. Match
equations and graphs first without using your graphing handheld, and then verify
your answers using your graphing handheld.
Note: These examples only investigate changes in the value of A.

Maximum and Minimum Values Come into Focus
When a parabola opens upward, the vertex will
be the lowest point on the curve. Any other
point on the parabola will have a larger value
for y. In the graph shown, the y-value of the
vertex is 1. This is the lowest value of y that is
on the parabola, and it is thus called the
minimum value of the function.
|
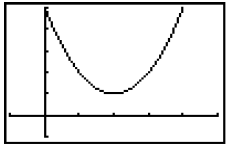 |
The graph shows a parabola with a minimum
value of 1 when x = 2.
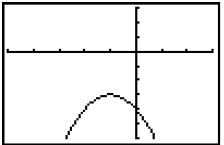
Likewise , when a parabola opens down, the
vertex will be the maximum value for y. This
graph shows a function with a maximum value
of -3 when x = -1.
|
 |
Use Your New Skill
Complete the table.
Equation
|
Opens up/
down
|
Function has a
maximum/
minimum |
Maximum/
Minimum
value |
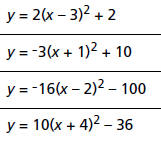 |
up |
minimum |
2 |
| |
|
|
| |
|
|
| |
|
|
A Quick Application
The equation y = -16(x – 4)2 + 259 models the flight of a model
rocket where y is the
height of the rocket and x is the time since it was launched. What is the
maximum
height of the rocket? How long after it was launched did it reach its maximum?
What does this have to do with this activity?
Student Worksheet
Look at some equations of linear functions and see how
translation applies.
1. Use your graphing handheld to graph y = x and y = x + 3 on the same axis. In
what two ways is the second equation a translation of the first?
__________________________________________________________________________
__________________________________________________________________________
Now look at some functions you might not have already studied and see if you can
apply your knowledge in a new situation.
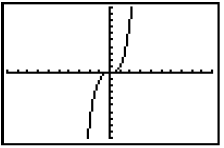
2. The graph of the function y = x3 goes
through the origin (0, 0). Look at the graph
of y = x3 shown and using the point at the
origin as the point you translate (as you did
the vertex), sketch the graph of y = x3 + 2.
Check your answer by graphing y = x3 + 2 on
your graphing handheld.
Note: You can either use  3
for the power of 3
for the power of
three or  3 to select 3:3. 3 to select 3:3. |
|
| |
|
|
3. Sketch y = (x – 2)3, and check your answer. |
 |
| |
| |
|
|
4. Sketch y = (x + 1)3 – 5, and check your answer. |
 |
| |


