Example 1: A car traveling down the freeway from the stop
light at the entrance ramp reached a
maximum speed of 75 miles per hour. The speed v , can be represented by the
inequality v ≤ 75mph .
The symbol " ≤ " is read “less than or equal to”. The
symbol in this problem represents all the real
numbers from 0 up to and including 75.
Graphically the symbol for the problem can be illustrated
using the number line:

Example 2. Suppose a submarine can descend safely to no
more than a maximum depth of 10,000 feet
below sea level. This situation can be represented by d > −10,000 , where d is
the depth of the
submarine in feet.
The symbol " > " is read “greater than”. The symbol in
this problem represents all the real numbers from
-10,000 to 0 not including -10,000.
Graphically the symbol for the problem can be illustrated
using the number line :

I. The symbols, <,≤,>,and ≥ are called Inequalities.
II. Inequalities represent two or more expressions that are not necessarily
equal.
III. Symbols:
The symbol < means less than. (The number is not
apart of the solution set )
The symbol ≤ means less than or equal to. (The number is part of the
solution set)
The symbol > means greater than. (The number is not apart of the
solution set)
The symbol ≥ means greater than or equal to. (The number is part of the
solution set) |
IV. Graphing Inequalities
• When an endpoint is included in the solution set as in, ≤ and ≥ , a closed
circle (or
brackets ) are used on the endpoint of the graph. See example 1.
• When an endpoint is not included in the solution set as
in, < and > , an open circle (or
parentheses ) are used on the endpoint of the graph. See example 2.
1. x < 3
a. Write a sentence that describes the inequality.
b. Graphically represent the verbal statement in part a.
2. To thaw ice, the temperature must be at least 32°F.
a. Write the symbolic rule using inequality symbols.
b. Graphically represent the symbolic rule in part a.
3. A college graduate is applying for a marketing position
at a major firm. The gross salary range,
g , is from $35,000 to $60,000 depending on experience.
a. Graphically illustrate the salary range for this
position.
b. Write two separate inequalities that represent the
salary where g is the gross salary for
the position.
c. Can g be a gross salary of $100,000? Why or why not?
d. Can g be a gross salary of $20,000? Why or why not?
e. Write a sentence describing all the possible gross
salaries for the marketing position.
The salary range can be represented by a single inequality
statement because the gross salaries fall
between two specific values . The single inequality representing this gross
salary is
$35,000 ≤ g ≤ $60,000 .
Compound Inequality : When two inequalities can be
written as one, the inequalities are written as one
compound inequality. The inequality is written from least to greatest with the
variable in between the two
values. The compound inequality a ≤ t ≤ b , is read “the variable t is between
and including the values
of a and b ”.
4. According to the American Heart Association, high blood
pressure (or hypertension) is a major
health problem in the world today. In the United States, 50 million people—about
one in every
four adults—suffer from the condition. Blood pressure classification is based on
the average of
two or more readings taken at each of two or more screenings. The systolic and
diastolic
readings, in mm Hg, for the three stages of high blood pressure are listed in
the following table.
| Category |
Systolic |
Diastolic |
| High blood pressure, Stage 3 |
180 or more |
110 or more |
| High blood pressure, Stage 2 |
160 to 179 |
100 to 109 |
| High blood pressure, Stage 1 |
140 to 159 |
90 to 99 |
For each of these stages, write an inequality representing
each of the three stages. Graph each of the
inequalities on a number line. Let s = the systolic blood pressure in mm Hg and
d = the diastolic blood
pressure in mm Hg.
a.
b.
c.
Exercises:
For each of the following inequalities, write a sentence
that describes the inequality and graphically
represents the verbal statement.
1. t < 4
2. x ≥ −3
3. −3 < b ≤ 7
For each of the following, write the symbolic rule using
inequality symbols and graphically represent the
symbolic rule.
4. To boil water, the temperature must be at least 100oC.
5. A plane’s cruising altitude from New York City to San
Diego must be between 28,000 feet and 36,000
feet.
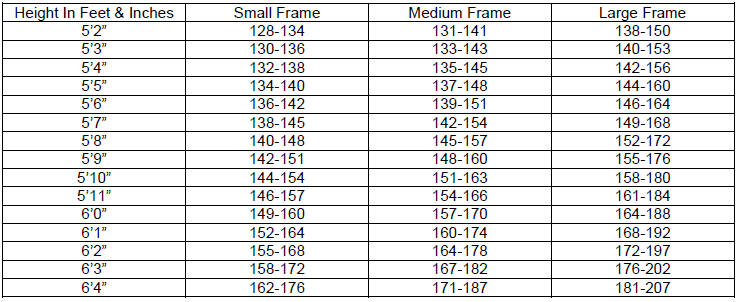
The table below illustrates the standard weight for men.
(Use the information in the
table to answer the following questions. Let W represents the weight in pounds
and let h represents the
height of a man in inches.

6. Use inequalities to write a symbolic rule for the
weight of a medium framed man who is 5’6” tall.
7. Graphically illustrate your answer in question 6.
According to the information provided in the table,
large-framed men who are 5’8” to 6’4” tall weigh 154 to
205 pounds.
8. Use inequalities to write two symbolic rules that are
stated in the sentence above.
9. Graphically illustrate your answer in number 8.
10. Using inequalities, write a symbolic rule for the
weight of small-framed men who are 5’7” to 6’0” tall.


