MA 110: SECTION 2.3 QUADRATIC FUNCTIONS
HOMEWORK: 9, 15, 19, 53, 57, 59, 61
A summary of quadratic functions is included on a separate document.
USING A QUADRATIC MODEL:
Referring to problems #58 & #60 on page 92, the marketing research department
for the
company that manufactures and sells "notebook" computers established the
following pricedemand-
revenue functions:
p(x) = 2,000 – 60x 1 ≤ x ≤ 25 and R(x) = xp= x(2000 – 60x) = -60x2 + 2000x
where p(x) is the wholesale price at which x thousand
computers can be sold, and R(x) is the
revenue (in thousands of dollars) from the sell of x thousand computers. Both
functions have the
physical domain 1 ≤ x ≤ 25
1. Sketch a graph of R (x).
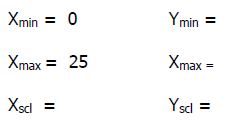
The domain of R(x) is given in the problem 1 ≤ x ≤ 25. This information tells
you how to
set the x window. You will have to figure out how to set the y window.

To decide on the y window values, you have to figure out
the range of R(x). Since R(x)
models revenue only positive values of y make sense in our problem. Thus, the
 is 0.
is 0.
To determine the
 ,
choose a value of x about half way between the
 and
and
 .
.
What value are you going to choose?
What is R of that value?
What will you choose for your
 .
.
The
 tells the calculator how often to make a tick mark. For easy readability of the
graph, you don’t want too many or too few tick marks. What scale would you try?
2. Find the output (the number of computers to the nearest
hundred) that will produce the
maximum revenue. You can determine this algebraically or graphically .
A. Algebraically: The x- coordinate of the vertex of a
quadratic function is x = -b/2a.
Compute x = -b/2a.
B. Graphically: Access the maximum feature by pressing the
2nd button then the TRACE
button. Choose option 4: maximum.
The calculator will prompt you for a left bound. Use your
(left/right) arrow keys to move
the cursor to the left of the vertex. Press ENTER. The calculator will then
prompt you for
a right bound. Use the (left/right) arrow keys again to move the cursor to the
right of the
vertex. Press ENTER. The calculator will then prompt you for a guess. Use the
(left/right) arrow keys to move the cursor in between your other marks. Press
ENTER.
(You must press ENTER a 3rd time.) The display at the bottom of your calculator
screen
will give the x and y coordinates of the vertex for R(x). The x-coordinate is
your answer.
3. What is the maximum revenue? This is the y-coordinate
of the vertex of R(x).
4. What is the wholesale price of the notebook computer
that produces the maximum
revenue?
5. The cost function C(x) = 4000 + 500x (as given on page
93 #62) represents the cost (in
thousands of dollars) to make x thousand computers.
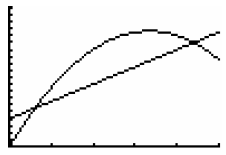
Graph R (x) = -60x2 + 2000x and C(x) = 4000 + 500x in the
same window.
Your graph should look like the one below .

There are two break -even points. Recall a breakeven
point is when the Revenue equals the Cost.
You can find the break-even points using the
intersect function on your calculator. See
instructions on the next page. An algebraic
method is not recommended for finding the
break even points.
Graphically: Access the intersect feature by pressing the
2nd button then the TRACE
button. Choose option 5: intersect.
The calculator will prompt you for first curve . Use your
(left/right) arrow keys to move the
cursor close to one of the intersection points. Use the (up/down) arrow keys to
move the
cursor to the revenue function. Press ENTER. The calculator will then prompt you
for
second curve. Use the (up/down) arrow keys again to move the cursor to the cost
function. Press ENTER. The calculator will then prompt you for a guess. Use the
(right/left) arrow keys to move the cursor close to the intersection point.
Press ENTER.
(You must press ENTER a 3rd time.) The display at the bottom of your calculator
screen
will give the x and y coordinates of one of the break-even points. Repeat the
process to
find the other break-even point.
The x-coordinate is the number of items to produce and
sell to break-even. The y-coordinate
is the revenue (and cost since they are equal at the break even points) that is
made by producing and selling that many items.
The break-even points are
6. A profit will occur for the company if the number of
items produced and sold is in between
the break-even x-coordinates.
For each of the following output levels state whether the
company will make a profit or a
loss.
A. 2,000 notebook computers
B. 4,000 notebook computers
C. 15,000 notebook computers
D. 25,000 notebook computers
7. The profit function
P(x) = R(x) – C(x) = -60x2 + 2000x – [4000 + 500x] =
-60x2 + 1500x - 4000
Find the number of notebook computers the company should
produce and sell to make
the maximum profit.
8. COMMENTS:
A. Note that the maximum revenue ($16,666, 167) was much
greater than the maximum
profit. Remember revenue is money in without deducting costs. The costs must be
subtracted from the revenue to calculate the profit.
B. The maximum revenue occurred when 16,667 notebook
computers were made and sold,
while the maximum profit occurred when only 12,500 notebook computers were made
and
sold. Thus, maximum revenue and maximum profit do not usually occur at the same
production level .
C. The price per notebook computer at which the maximum
revenue occurred was p(16.667)
= $1,000, while the price per notebook at which the maximum profit occurred was
p(12.5)
= $1250. Again, the maximum revenue and maximum profit do not occur at the same
production levels. The production level (how many items you want to sell)
affects the
price.


