Strategy: Reading Tables
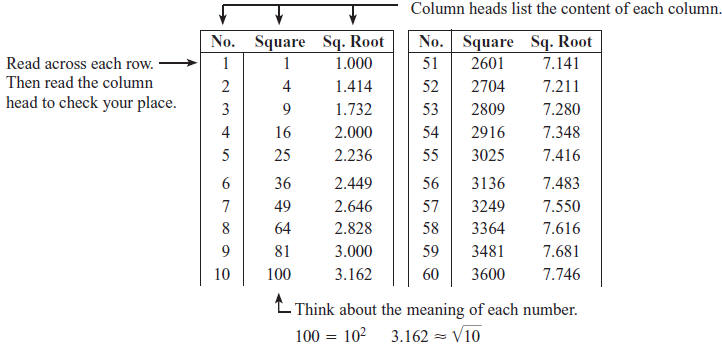
In some cases, you may prefer to find squares and square roots using the Table
of Squares and
Square Roots on page 957 of your text. (Note that the table gives square roots
rounded to three
decimal places .) Many tables, including this one, have several columns of data
for each number. It
is important that you always check the column heads as you read numbers in a
table to make sure
you have found the data you need.

STUDY TIP
Use a Ruler
A straight edge, such as a ruler or the edge
of a piece of paper, can help you keep your
place as you read a table. Placing the ruler
below the row you are reading helps focus
your eyes on the entry you need to read. |
STUDY TIP
Estimating from the Table
The Table of Squares and Square Roots may
be used to estimate certain squares
and square roots. For example, you can
determine that 7.62 ≈ 58 and
Unless a rough estimate is sufficient, it is
generally better to use a calculator for such
numbers. |
Questions
Use the Table of Squares and Square Roots above for Questions 1–3.
1. Find the square of each integer.

2. Find the square root of each integer.

3. Estimate the value of each expression to the nearest
whole number.

Visual Glossary
The Now box on page 627 lists the key vocabulary introduced in Chapter 10. The
key vocabulary
list at the beginning of each lesson may include prior key vocabulary with page
references. Also use
the Skills Review Handbook to review key vocabulary from prior courses. Use the
visual glossary
below to help you understand some of the key vocabulary used in Chapter 10. You
may want to copy
these diagrams into your notebook and refer to them as you complete the chapter.
GLOSSARY
parabola (page 628) The
U-shaped graph of a quadratic
function.
vertex (page 628) The lowest
or highest point on a
parabola.
axis of symmetry (page 628)
The line that passes through
the vertex and divides the
parabola into two symmetric
parts.
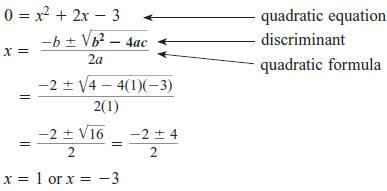
quadratic equation
(page 643) An equation that
can be written in the standard
form ax2+ bx + c = 0,
where a ≠ 0.
quadratic formula
(page 671) The solutions
of the quadratic equation
ax2+ bx + c = 0
are
where a ≠ 0 and b2 -4ac≥ 0.
discriminant (page 678) The
expression b2 -4ac where
a, b, and c are coefficients
of the quadratic equation
ax2+ bx + c = 0. |
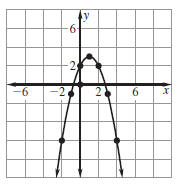
Graphing Quadratic Equations
To sketch the graph of a quadratic equation, first determine
whether the parabola opens up or opens down.
 Find the
axis of symmetry:
The x-coordinate of the vertex is also
Find the y-coordinate by substituting the x -coordinate into
the function and simplifying.
y = -(1)2 + 2(1) + 2 = 3
The vertex is (1, 3).
Make a table of values for points
on one side of the axis of symmetry.

Plot the points . Then reflect the points
plotted in the axis of symmetry. Draw
the parabola through the points.

Solving Quadratic Equations
As you solve quadratic equations, you will apply new vocabulary
in many steps in the process.

|


