Safety
Wear gloves to ensure that no bacteria are transferred from your fingertips to
the swab
sample. The bacteria collected today will be no more pathogenic than what you
are exposed to
everyday, but do not touch your mouth, nose, ears or eyes during this lab
activity.
Recently, scientists have found bacteria that measure 20–400 nanometers in
size. Originally
thought to be viruses, these nanobacteria—also called nanobes—may be the
smallest living
organisms on Earth! These super-small bacteria resemble the fossilized
structures found on
meteorites that originated on Mars. So, not only do we find bacteria everywhere
here on Earth,
but maybe even in the vast distances in space!
Materials
• sterile Petri dishes with
nutrient agar
• sterile cotton-tipped
applicators or swabs
• disposable gloves
• scotch tape
• permanent fine-tipped
ink marker
• metric ruler
• paper, pencils, graph
paper
• incubator (optional)
• digital camera (optional)
Question
Out of all the things you touch everyday, where
would you find the most bacteria? Why?
Make a Prediction
Example prediction: I think that a doorknob would have more
bacteria on it than anyplace else, because many people touch a
doorknob with their hands.
Procedure
1. Decide with your group where you will collect your bacteria sample.
2. Take the packaged cotton swab and closed Petri dish to where you will collect
the sample.
3. Rub the tip of the cotton swab across the area you are sampling. Twist the
swab as you swipe
it along the surface to help collect a good amount of bacteria onto the swab.
4. Open the Petri dish just enough to fit the tip of the swab into it. Gently
rub and twist the swab
at the center of your dish.
5. Immediately close the dish, seal it along the perimeter (edge of the lid)
with clear tape.
6. Label the tape with your name, date, time, and what you sampled. Throw the
cotton swab
into the trash.
7. Place your dish where instructed by the teacher to be stored until the next
class. (One option
is to place the dish in an incubator (such as, a styrofoam cooler with a lamp)).
Record Your Observations
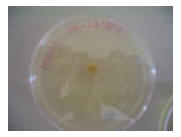
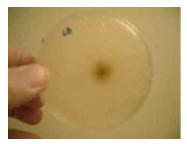
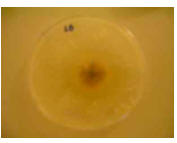
At the beginning of the next three classes, use a metric ruler to measure the
size of the bacterial
growth in the dish. Then, fill out the data table below for each observation.
| # |
Date
& Time |
Observations
( drawing or picture ) |
Size of Growth
(measure and describe) |
| 1 |
Wednesday,
January 15, 2008;
10:00 a.m.
(48 hours) |
 |
There is 1 circle. The diameter of the
circle of bacterial growth is 0.4 cm.
You will use this number to compute the
surface area in the next table. |
| 2 |
Friday,
January 17, 2008;
10:00 a.m.
(96 hours) |
 |
The circle has grown to a diameter of
1.2 cm. |
| 3 |
Tuesday,
January 22, 2008;
10:00 a.m.
(168 hours) |
 |
The circle is now 3.2 cm in diameter. |
Analyze the Results
1. Write the equation for the radius of a circle (radius of a circle = r). r =
d/2
2. Draw a line on the circle below to indicate the radius of a circle.

3. Write the number for π (pi). π = 3.14159… (Students may use 3.14 in their
calculations, but
should round their answers up or down to the nearest significant digit .)
4. Write the equation for the surface area of a circle. surface area of a circle
= πr2
5. Write the equation for the circumference of a circle. circumference of a
circle = 2πr
6. Calculate the surface area of bacterial growth using data from your data
table.
Calculation of Bacterial Surface Area Growth
Hours of
Growth |
Calculate the surface area of bacterial growth.
Show your calculations. Explain your work. |
| 48 hrs |
πr2 = surface area of a circle
The diameter of the circle from the table above is 0.4 cm at 48 hrs.
Using the formula for the area of a circle, we get:
3.14 x (0.4/2)2 = 3.14 x 0.22 = 0.13 cm2.
This is the surface area of the bacterial growth at 48 hrs. |
| 96 hrs. |
πr2 = surface area of a circle
The diameter of the circle from the table above is 1.2 cm at 96 hrs.
Using the formula for the area of a circle, we get:
3.14 x (1.2/2)2 = 3.14 x 0.62 = 1.13 cm2.
This is the surface area of the bacterial growth at 96 hrs. |
| 168 hrs. |
πr2 = surface area of a circle
The diameter of the circle from the table above is 3.2 cm at 168 hrs.
Using the formula for the area of a circle, we get:
3.14 x (3.2/2)2 = 3.14 x 1.62 = 8.04 cm2.
This is the surface area of the bacterial growth at 168 hrs. |
7. Calculate the bacteria and nanobe populations. First, convert bacterial
surface areas from cm2
to μm2 or to nm2. Remember:
1 cm2 = 10,000 μm2 = 10,000,000 nm2
surface area of a bacterium ~ 9 μm2
surface area of a nanobe ~ 400 nm2
Calculation of Bacteria and Nanobe Populations
Hours of
Growth |
Surface Area of
Growth |
Bacteria Population |
| 48 |
0.13 cm2 |
0.13 cm2 × 10,000 μm2/cm2 = 1,300 μm2
1,300μm2/9μm2 ~ 144 bacteria |
| 96 |
1.13 cm2 |
1.13 cm2 × 10,000 μm2/cm2 = 11,300 μm2
11,300 μm2/9 μm2 ~ 1,256 bacteria |
| 168 |
8.04 cm2 |
8.04 cm2 × 10,000 μm2/cm2 = 80,400 μm2
80,400 μm2/9μm2 ~ 8,933 bacteria |
Hours of
Growth |
Surface Area of
Growth |
Nanobe Population |
| 48 |
1,300 μm2 |
1,300 μm2 × 1,000 nm2/μm2 = 1,300,000 nm2
1,300,000 nm2/400 nm2 = 3,250 nanobes |
| 96 |
11,300 μm2 |
11,300 μm2 × 1,000 nm2/μm2 = 11,300,000 nm2
11,300,000 nm2/400 nm2 = 28,250 nanobes |
| 168 |
80,400 μm2 |
80,400 μm2 × 1,000 nm2/μm2 = 80,400,000 nm2
80,400,000 nm2/400 nm2 = 201,000 nanobes |
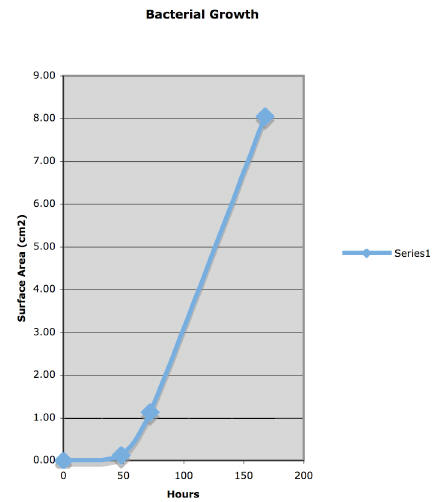
8. Using your results from the previous page , graph the growth of the
bacteria versus time.
Determine the best scale to use for graphing by looking at the ranges of your
growth data.
(Students can use graph paper to graph the growth of the bacteria, and then
attach their
graph to this page.)

Draw Conclusions
1. When might it be useful to know how fast bacteria can grow at certain
temperatures?
Example answer: Knowing how to keep bacteria from growing would be very
important
when storing food either at home or in a restaurant.
2. Describe your graph. Did anything surprise you? Explain.
Example answer: I expected bacterial growth to have a linear graph , but I got
a curved
graph instead.
3. As more time goes by, more bacteria grow. What kind of function is this?
Example answer: This is a positive or direct function. As one variable
increases, the other
variable also increases.
4. Nanobacteria are so small they cannot be seen with a light microscope.
Knowing that doctors
identify what type of bacterial infection a patient has and what kind of
medicine a patient
needs by looking at the bacteria through a light microscope, what problems might
doctors
have if nanobacteria were to also cause infection?
Example answer: Doctors would not be able to identify the bacteria with
optical microscopes
and may not be able to prescribe the proper antibiotic. Medical labs may need to
use more
powerful microscopes to identify the nanobacteria.
Going Further Look at your graph.
a. How many bacteria do you think will be in your dish in 200 hours? Write
your prediction.
Example prediction: I think there will be about 11,000 bacteria because the
surface area
would be about 10 cm2 in about 200 hours.
b. What could you do to test and see if you are right?
Example answer: Continue to grow the bacteria longer and then take another
measurement.
c. If you let your bacterial population grow for 1 month, how would the
bacterial growth in the
Petri dish differ from growth in the location you took your sample from?
Example answer: Eventually, the bacteria in the Petri dish would run out of
room and they
would stop growing, whereas on the doorknob, there is more room to grow.
Extra Credit Follow the steps you outlined in answer “b” above. If
time allows, test to see
whether your prediction in answer “c” is accurate.


