Chapter 6 – Section 1: Graphing Parabolas
When graphing a parabola, follow the following steps :
A. Find the vertex, focus, directrix, and the direction of the parabola.
B. Find the endpoints of the focal chord by adding and subtracting 2c to either
the x-value or the y-
value of the focus depending on the direction of the parabola.
C. Plot and label the vertex, focus, and the endpoints of the focal chord in
point form, draw the curve of
the parabola with a solid line , draw the directrix with a dashed line, and label
the directrix with its
equation.
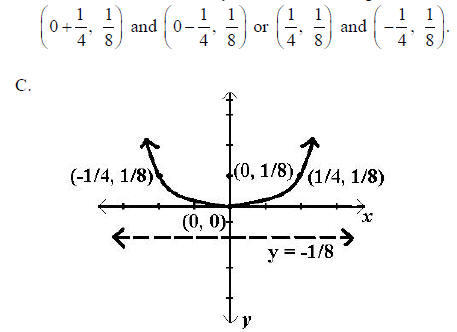
Example: Graph

A. The vertex is (0, 0) and the standard form is x2 = 4cy.
Therefore,1/2=4c and .c =1/8 Because x is the
squared term and c is positive, the parabola opens up. The focus must therefore
be on the y-axis
above (0, 0). Since c=1/8 the focus must be Since
the parabola opens up, the directrix must
be parallel to the x-axis and below (0, 0). Therefore the equation of the
directrix is y = -1/8
B. If c = 1/8 then  Since the parabola
opens up,1/4 is added and subtracted from the x value
of the focus while the y value is unchanged. Therefore, the endpoints of the
focal chord are
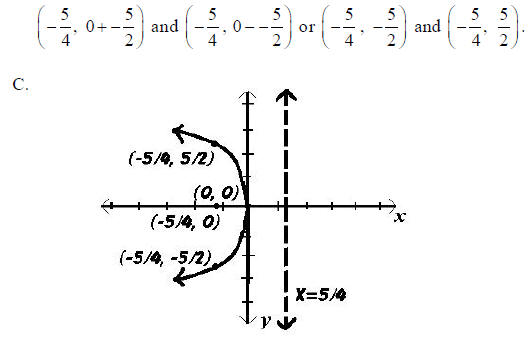
Example: Graph y2 = -5x
A. The vertex is (0, 0), and the standard form is y2
= 4cx. Therefore, -5 = 4c and . c = -5/4
Because y is the squared term and c is negative , the parabola opens left. The
focus must therefore be on the x-axis
left of (0, 0). Since c =-5/4 the focus must be Since
the parabola opens left, the directrix
must be parallel to the y-axis and right of (0, 0). Therefore the equation of
the directrix is x = 5/4
B. If c =-5/4 then  Since the parabola opens
left, -5/2 is added and subtracted from the y
value of the focus while the x value is unchanged. Therefore, the endpoints of
the focal chord are
Exercises for Graphing Parabolas
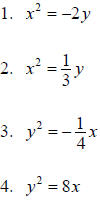
Graph the following parabolas. Label the vertex, focus, and endpoints of the
focal chord. Draw the directrix
and label with its equation.
Chapter 6 – Section 1: Additional Application
Problems
5. Translate into a mathematical model and solve:
The diameter of a parabolic flashlight is 4 centimeters. The focal length
(distance from the focus to the
parabolic surface) is 0.5 centimeters. Determine the maximum depth of the
flashlight. Round the answer
to the nearest centimeter. Include correct units.
a. Equation of parabola:_____________________
b. Depth:_____________
6. Translate into a mathematical model and solve:
A parabolic satellite TV receiving dish will have a receiver placed at the
focus. Where should the
receiver be placed if the dish is 3 feet in diameter and has a depth of 1 foot?
Round the answer to 2
decimal places .
a. Equation of parabola:___________________
b. The receiver should be placed ____ feet from the
vertex.
Chapter 6, Section 2 – Additional Application
Problem
7. Translate into a mathematical model and solve:
An arch of a bridge has the shape of the top half of an ellipse . The arch is 40
feet wide and 12 feet high
at the center. Find the equation of the complete ellipse. Find the height of the
arch 10 feet from the
center at the bottom. Round to the nearest hundredth.
a. Equation of ellipse: ____________________
b. Height of arch:________________________ Include correct units.
Chapter 6, Section 2 – Finding the Equation of a
Hyperbola given vertices and asymptotes
Find the equation of the hyperbola with vertices (6, 0) and (–6, 0) and
asymptotes and
and .
.
Solution :
Since the vertices are (±6,0) , the x-axis must be the major axis, the center
must be (0, 0), the general
equation to be used must be , and a must be
6. Therefore, the equation
 can be written
with confidence. Only b still needs to be found. The slope of the equation for
the asymptote of a hyperbola
is the change in y divided by the change in x. 6 is the change in x and b is the
change in y, so
Solving this proportion gives b = 4 , and the equation of the hyperbola is or
or
Chapter 6, Section 2 – Additional Exercise for Finding Hyperbola Equations
8. Find the equation of the hyperbola with vertices (–4, 0) and (4, 0) and
asymptotes and
and

Chapter 6, Section 2 – Graphing Hyperbolas
When graphing a hyperbola, follow the following steps:
A. Determine the major axis, the center, and the vertices. Plot and label the
vertices.
B. Determine helpful points on the other axis and use these points and the
vertices to draw a box around
the center of the hyperbola.
C. Draw the asymptotes through the corners of the box using dashed lines.
D. Find the foci by using c2 =a2 +b2 to find c.
Add and subtract c to either the x or the y value of the
center of the hyperbola depending on the direction the hyperbola opens.
Example:
A. Because the x2 is positive, the major axis is the x-axis, the
standard form of the equation is , and the
center is (0, 0). Since  Since the major axis
is the x-axis, the vertices are found by adding and
subtracting a to the x value of the center giving
(  , 0) and (-
 , 0).
, 0).
Plot and label the vertices.
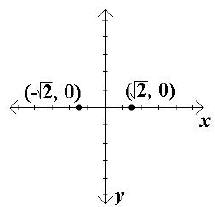
B. Helpful points on the y-axis are found by adding and
subtracting b to the y value of the center. Since b2 = 9,
b = 3, and the helpful points are (0, 3) and (0, –3).
Plot the helpful points and draw a box around the center
using the vertices and these points. These helpful points
do not have to be labeled but certainly can be.
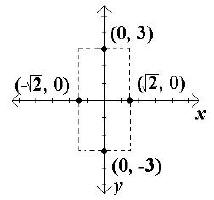
C. Draw the asymptotes through the corners of the box
using
dashed lines.
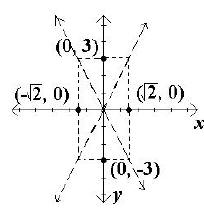
D. Since c2 = a2 + b2 , c2
= 2 + 9 = 11, and c =
 . Because
the major axis is the x-axis, c is added and subtracted to
the x value of the center. Therefore the foci are (
 , 0)
, 0)
and (-  , 0).
, 0).
Plot and label the foci. Then draw in the hyperbola
making sure that it approaches the asymptotes but does
not touch the asymptotes or look as if it will cross the
asymptote.
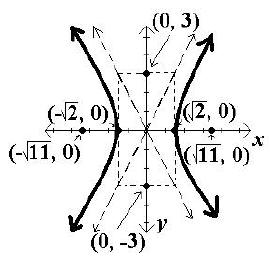
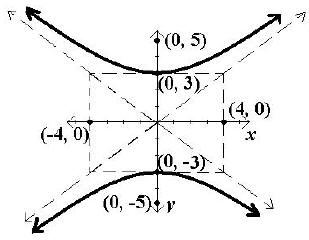
Example:

A. Because the y2 is positive, the major axis is the y-axis, the
standard form of the equation is
 , and the center is
(0, 0). Since a2 = 9, a = 3. Since the major axis is the y-axis, the
vertices are found by adding and subtracting a to the y value of the center
giving (0, 3) and (0, –3).
Plot and label the vertices.
B. Helpful points on the x-axis are found by adding and subtracting b to the x
value of the center. Since
b2 = 16, b = 4, and the helpful points are (4, 0) and (–4, 0).
Plot the helpful points and draw a box around the center using the vertices and
these points. These
helpful points do not have to be labeled on the graph but certainly can be.
C. Draw the asymptotes through the corners of the box using dashed lines.
D. Since c2 = a2 + b2 , c2
= 9 +16 = 25, and c = 5. Because
the major axis is the y-axis, c is added and subtracted to
the y value of the center. Therefore the foci are (0, 5)
and (0, –5).
Plot and label the foci. Then draw in the hyperbola
making sure that it approaches the asymptotes but does
not touch the asymptotes or look as if it will cross the
asymptote.
Chapter 6, Section 2 – Exercises for Graphing
Hyperbolas
Graph each of the following. Label the vertices, and the foci. Graph must
approach directly drawn
asymptotes, if applicable.

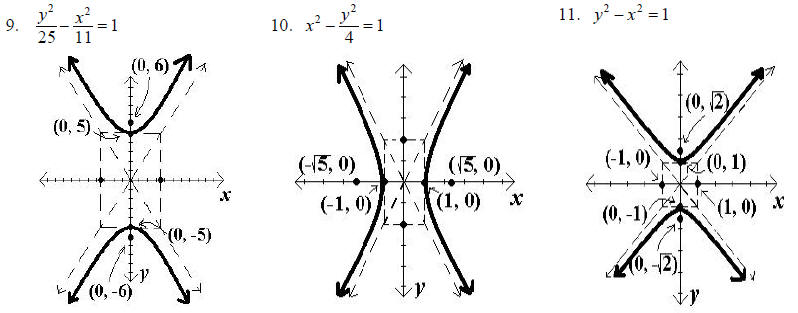
Answers for Chapter 6, Section 1 & 2 Exercises
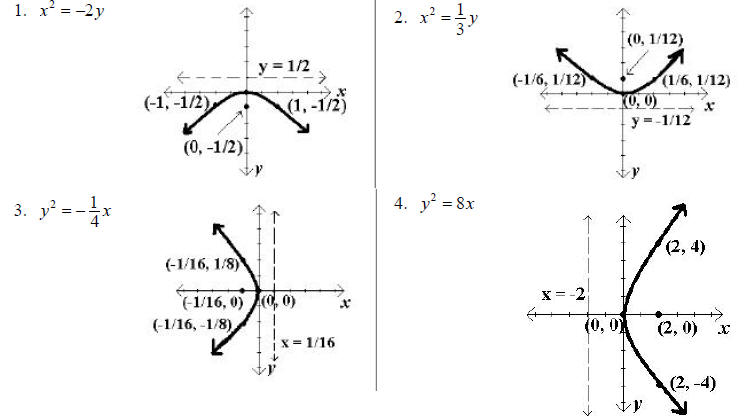
5. a. Equation: x2 = 2 y or y2 = 2x;
either is correct b. 2 centimeters
6. a. Equation:  or ;
or ; either is correct. b. 0.56
7. a. Equation: or
or
 either is correct. b. 10.39 feet
8. or
or 
