Higher order polynomials
While I certainly don't expect you to be able to graph an
arbitrary polynomial off the top of your head, it's worth understanding
some basic properties that these graphs might have.
Fact 1:
Assuming that


and

Say WHAT?
OK, let's pick this apart. First off, the lim stands for limit. When we write
 we are asking the question “what can we
say about the values of f (x) for very large values of x?” A major point to this
class is to explore this question more carefully, but
we can deal with this on an intuitive level right now. Furthermore, this
language helps us understand the nature of polynomial
graphs.
When we write
 we are saying that f (x) may be made as large as we like, by taking x to be
sufficiently large.
For example, I can make x2 larger than, say 1, 000, 000 by choosing x to be larger than 1,
000. There's no
number that you can pick that I can't do this for. Thus,
 You can see this in the graph of y = x2 since the graph
grows without bound as you move to the right.
Now, what about
 It seems the only reasonable thing to call this would be -∞. Of course, it's
easy to make these
same claims about ±xn for any polynomial degree n. Now,
 depending on whether
  is positive or negative . (This
is the definition of the sign function .) Thus, Fact 1 states that the highest
order term always determines the limit. For example,

We can also take limits as
 For example,
 This is because
when we cube a monstrously negative
number, we get an even more monstrously negative number . Make sense? However,
 since the even power
returns positive numbers. This is why the  arises in the second formula.
Geometrically, this all states that, on a global scale,
the graph of  looks very much like the
graph of 
Example:
Here are graphs of y = x5 - 8 x3 + 12 x - 1 and y = x4 - 3 x2 - 2 over the
fairly large interval [-10, 10]. You should be able to tell
which is which.

What about on a more local level? It can be hard to know for sure, but we can
narrow things down using the following:
Fact 2:
A polynomial of degree n can have at most n roots.
Recall that a root is realized geometrically as an x- intercept . Thus, the graph
can cross the x-axis at most n times. Furthermore, if
we shift the graph up or down, it is still the graph of a polynomial; thus, it
can still cross the x-axis at most n times. As a result,
the original graph can cross any horizontal line at most n times. Practically,
this places a restriction on how many times your
pencil can go up and down while drawing the graph .
Example:
Here are graphs of the same two functions over smaller intervals. Can you again
tell which is which based on the local
information?

Exercises
1. Make a rough sketch of the graph of each of the following functions.
(a) y = 2 x + 3 (b) y = 5 - 4 x (c) y = x2 - 2 x + 5 (d) y = 3 x2 - 5 x - 2
(e) y = 2 - 3 x - x2
2. Find the equation of the line that goes through the specified points.
(a) (-1, 3) and (4, 2)
(b) (2, 4) and (5, 6)
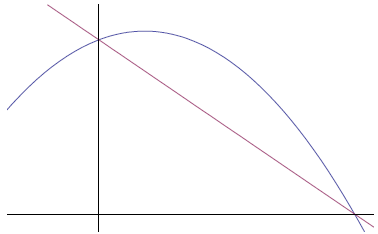
3. The parabola shown in the picture below is the graph of y = 5 + x - x2. Find
an equation of the line shown in the picture.

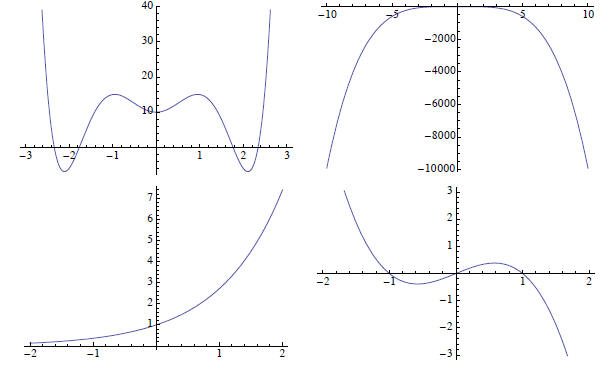
4. Match the groovy formulae with the groovy pictures. You should be able to
state good reasons for your selections.
(a) y = x - x3
(b) y = x2 - x4
(c) y = x6 - 8 x4 + 12 x2 + 10
(d) 


