Nearly every business, industry, or branch of government
has to plan work on
complex problems . They need to make decisions that will solve problems that
often encompass many variables and at the same time will efficiently use
materials,
money, time, etc. Matrix models and vertex-edge graph models are often
helpful in solving such problems.
In earlier study of these models, you learned how to use
discrete mathematical
methods to answer questions like these:
■After a snowstorm, how can a county decide which
roads to plow so that
it is possible to travel from every town to every other town on plowed
roads, and the total number of miles plowed is minimum?
■ What route should a salesperson travel to visit each client once and
make
the travel distance or cost minimal?
■ What is an efficient way of tracking inventories of products?
■ How can pollution be tracked through an ecosystem?
4.1 Matrix Models
In Course 1, you used adjacency matrices to represent
vertex-edge graphs. In
the algebra and geometry review sections of this book, you revisited how
matrices
can be used to solve systems of linear equations and to represent polygons
and geometric transformations. A matrix is a rectangular array of numbers.
The matrix  has
dimension 2 by 3 since it has two rows
and three columns. A square matrix has the same number of rows and columns.
The main diagonal of a square matrix is the diagonal line of entries running
from
the top left corner to the bottom right corner.
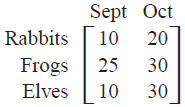
EXAMPLE 1: Under The Willow is a toy company in
Seattle that makes
stuffed toys, including rabbits, frogs, and willow elves. The
owner designs the toys, and then they are cut out, sewn, and
stuffed by independent contractors. Each contractor agrees to
make the number of stuffed toys shown in the following matrix
for the months of September and October.
Number of Toys to Make
Two of the contractors, Elise and Harvey, know from
experience
how many minutes it takes them to make each type of toy.
The times are shown in the matrix below.
Time per Toy (in minutes)

a. Matrix multiplication can be used to find a matrix that
shows
the total number of minutes each of the two contractors will
need in order to fulfill their contracts for each of the two
months, as shown below.

Thinking of the labels for the product matrix helps you
interpret
the entries. The row labels, Elise and Harvey, come from
the first matrix in the indicated product. The column labels,
Sept and Oct, come from the second factor . So, for example,
Harvey will need 3,050 minutes to fulfill September orders
and 6,100 minutes to fill October orders.
b. Minute totals can be converted to hours using scalar
multiplication
as shown below.

EXAMPLE 2: Similar to operations with numbers,
matrices can be combined
using the operations of addition , subtraction, and matrix multiplication
(as seen above). Consider the following matrices.

a. In order to add or subtract two matrices, they must
have the
same dimension. To add (or subtract) two matrices, you add
(or subtract) corresponding entries.

b. In order to multiply two matrices, the number of
columns in
the first matrix must equal the number of rows in the second.
Matrix multiplication is not commutative. The process of
matrix multiplication is illustrated below.

c. It is also possible to multiply a matrix can be
multiplied by a
number k. This is done by multiplying each entry in the
matrix by k. This is called scalar multiplication.

EXAMPLE 3: Vertex-edge graphs are often used to
model transportation networks
such as airline routes. The network shown below and its
adjacency matrix indicate airline routes between various cities.
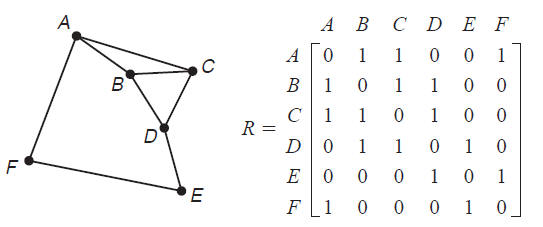
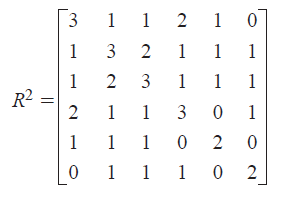
Squaring the adjacency matrix (R^2=R*R) shows the number
of two-stage routes connecting various cities. For example,
there are two two-stage paths from city A to city D.
Similarly, R^3=R*R*R shows the number of three-stage
routes connecting cities.
Check Your Understanding 4.1
Check your understanding of matrices and operations on
them.
1. Using the given matrices, find the indicated sum ,
difference, and products.

2. During a recent inventory, Just Jeans found that they
had 35 pairs of
Levis in stock in the following waist sizes.
| Waist Size |
Number of Pairs |
| 28 |
6 |
| 30 |
14 |
| 32 |
9 |
| 34 |
6 |
For other brands carried by the store, the number of pairs
in comparable
sizes ordered from smallest to largest is shown in the chart below .
| Brand |
Number of Pairs |
| Tommy Hilfiger |
0, 4, 0, 5 |
| Polo |
1, 2, 3, 8 |
| Wrangler |
6, 2, 2, 2 |
| JNCO |
3, 0, 0, 4 |
| Calvin Klein |
7, 4, 1, 5 |
a. Represent the current Just Jeans inventory using a
matrix.
■ How many pairs of jeans in stock are size 32?
■ Of which brands are there the fewest jeans?
b. Sales over the last year indicate that the store sells
twice as many
Tommy Hilfiger and Calvin Klein jeans as the other four brands.
Sizes 30 and 32 sell twice as fast as sizes 28 and 34. Suppose the
stock is filled in so that Just Jeans now has inventory of 12 pairs of
jeans in each of the most popular sizes of the best-selling brands.
Represent the restocked inventory with a matrix.
c. In the following week, the store sells the following:
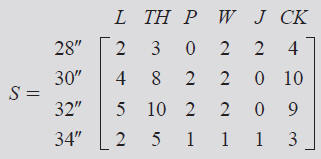
The profit per pair of jeans is $16.00 on Levi, $20 on
Tommy
Hilfiger, $18.50 on Polo, $15 on Wrangler, $12.00 on JNCO, and
$16 on Calvin Klein.
■ Use matrix operations to determine how much profit the
store
made that week on the largest size sold. How much profit was
made on the smallest size sold?
■ Determine the total profit on jeans sales for the week.
3. Construct the route (adjacency) matrix for the network
below.
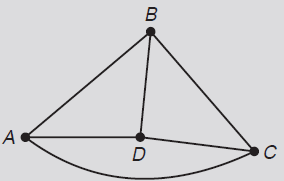
a. Find the matrix that describes the two-stage paths
between vertices,
and then give a vertex sequence for the various routes from D to C.
b. How many three-stage paths start and finish at the same point? How
many three-stage paths start and finish at different points?


