 Example 9. Find the y-intercept of the quadratic
function defined by f(x) =
x2 − 3x − 11.
Evaluate the function at x = 0.
f(0) = (0)2 − 3(0) − 11 = −11.
The coordinates of the y- intercept are (0,−11).
Putting it All Together
We will find both x- and y-intercepts extremely useful when drawing the graph of
a
quadratic function .
 Example 10. Place the quadratic function y = x2 +2x−24 in vertex form. Plot
the vertex and axis of symmetry and label them with their coordinates and
equation,
respectively. Find and plot the x - and y-intercepts of the parabola and label
them with
their coordinates.
Take half of the coefficient of x , square, then add and subtract this amount to
balance the equation. Factor and combine coefficients.
y = x2 + 2x + 1 − 1 − 24
y = (x + 1)2 − 25
The graph is a parabola that opens upward; it is shifted 1 unit to the left and
25 units
downward. This information is enough to plot and label the vertex, then plot and
label
the axis of symmetry, as shown in Figure 5(a).
To find the x-intercepts, let y = 0 in y = x2 + 2x − 24.
0 = x2 + 2x − 24
The leading coefficient is a 1. The integer pair −4 and 6
has product −24 and sum 2.
Thus, the right-hand side factors as follows.
0 = (x + 6)(x − 4)
In order that this product equals zero, either
x + 6 = 0 or x − 4 = 0.
Solve each of these linear equations independently.
x = −6 or x = 4.
Recall that we let y = 0. We’ve found two solutions , x = −6 and x = 4. Thus, we
have
x-intercepts at (−6, 0) and (4, 0), as pictured in Figure 5(b).
Finally, to find the y-intercept, let x = 0 in y = x2+2x−24. With this
substitution,
y = −24. Thus, the y-intercept is (0,−24), as pictured in Figure 5(c). Note that
we’ve
also included the mirror image of the y-intercept across the axis of symmetry.
 |
(a) Plotting the vertex
and axis of symmetry. |
(b) Adding the x -intercepts
provides added accuracy. |
(c) Adding the
y-intercept and its
mirror image provides
an excellent final graph. |
Figure 5.
Let’s look at one final example.
 Example 11. Plot the parabola represented by the equation f(x) = −2x2−7x+15.
Plot and label the vertex, axis of symmetry, and the x- and y-intercepts.
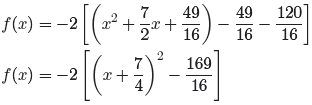
First, factor out a −2.

Half of 7/2 is 7/4. Squared, this amounts to 49/16. Add
and subtract this last amount
to keep the equation balanced .

The first three terms inside the parentheses form a
perfect square trinomial. The last
two constants are combined with a common denominator.

Finally, redistribute the −2.

The graph of this last equation is a parabola that opens
downward, translated 7/4 units
to the left and 169/8 units upward. This is enough information to plot and label
the
vertex and axis of symmetry, as shown in Figure 6(a).
To find the y-intercepts, set f(x) = 0 in f(x) = −2x2 − 7x + 15. We will also
multiply both sides of the resulting equation by −1.
0 = −2x2 − 7x + 15
0 = 2x2 + 7x − 15
After comparing 2x2 +7x−15 with ax2 +bx+c, we note that the integer pair −3 and
10 have product equal to ac = −30 and sum equal to b = 7. Use this pair to
express
the middle term of 2x2 + 7x − 15 as a sum and then factor by grouping.
0 = 2x2 − 3x + 10x − 15
0 = x(2x − 3) + 5(2x − 3)
0 = (x + 5)(2x − 3)
By the zero product property, either
x + 5 = 0 or 2x − 3 = 0.
Solve these linear equations independently.
x = −5 or 
These x- values are the zeros of f (they make f(x) = 0), so we have x-intercepts
at
(−5, 0) and (3/2, 0), as shown in Figure 6(b).
 |
(a) Plotting the vertex
and axis of symmetry. |
(b) Adding the x-intercepts
provides added accuracy. |
(c) Adding the y-intercept
and its mirror image provide
an excellent final graph. |
Figure 6.
Finally, to find the y-intercept, set x = 0 in f(x) = −2x2 − 7x + 15 to get f(0)
= 15.
Note the positioning of the y-intercept (0, 15) and its mirror image across the
axis of
symmetry in Figure 6(c).


