The article "Exporting Figures for Publication" in the
June, 2000
MATLAB digest introduced the MATLAB function exportfig.m as a
tool to help produce publication-quality output of figures and plots. The
main goal of the function is to make it easier to control the size, the
font sizes, the line widths and the color of the output. This article
describes some of the features in a new version of exportfig.m and
introduces three new functions previewfig.m, applytofig.m and
restorefig.m to complement the functionality of exportfig.m.
Download these files individually by clicking on the provided links and
place the downloaded files on your MATLAB path.
The roles of these four functions are summarized in the
table :
| exportfig.m |
export the figure to a file |
| previewfig.m |
preview the figure |
| applytofig.m |
apply the export options directly to the figure |
| restorefig.m |
restore the figure to the original state |
There are many new features in the exportfig.m family, but
this
article will focus on these four features:
• Tight bounding box
• Color-to-style mapping
• Preferences
• Separate text and bitmap output
Each of these features will be explained and illustrated
with the plot created by executing the
following MATLAB code:
x=0:.1:20;
y1=sin(x);
y2=cos(x);
plot(x,y1,x,y2);
legend('sin','cos');
axis([0 20 -2 2]);
grid on;
title(' Plot of sin and cos');
xlabel('x');
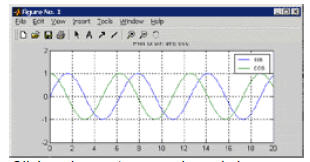
Now resize the plot until it is a few inches in height and
looks roughly like the illustration below:

Click on image to see enlarged view
Notice how the title and x-label are cut off. One of the
new features of the exportfig family is the
"tight bounding box" option, which resizes the figure so that all the plots and
labels fit perfectly
inside the figure without any extra space around the edges, and without clipping
any text objects.
The command:
exportfig( gcf ,'test.eps','bounds','tight');
will export the figure with a tight bounding box to the
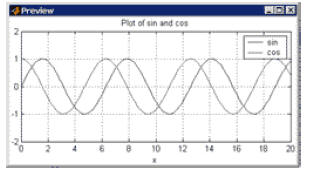
file 'test.eps'. To create a preview of the figure
as it would export with a tight bounding box type
previewfig( gcf ,'bounds','tight');
The preview will appear in a separate figure window which
you should close after viewing. The
preview should look like this :

Click on image to see enlarged view
To change the figure to have a tight bounding box type
oldstate = applytofig(gcf,'bounds','tight');
and to restore the figure to its original state type
restorefig(gcf,oldstate);
The value returned by applytofig is a structure storing
the figure's state as it existed before
calling applytofig. If you make several changes to a figure using applytofig
make sure you
don't overwrite the original state structure, since the call to restorefig only
restores the figure to
the supplied state.
Another new feature in exportfig.m is the ability to map
line colors to line styles, which is very
useful when exporting a color plot to a black-and-white format. The command:
exportfig(gcf,'test.eps','linestylemap','bw');
will export the current figure with all colored lines
mapped to the four line styles using the default
mapping. You can customize the algorithm used to perform the mapping by
supplying the name of
a function to evaluate. For example, the command:
exportfig(gcf,'test.eps','linestylemap','mylinemap');
would execute the user function mylinemap instead of
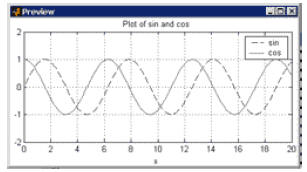
applying the default function. For our
example figure the output of the command:
previewfig(gcf,'bounds','tight','linestylemap','bw');
would look like:

Click on image to see enlarged view
Since it's tedious to have to type out all the options to
exportfig every time, the new function
allows you to collect those options into a structure and pass only the
structure, or to set the options
to be the default options. For example, type
opts = struct('bounds','tight','linestylemap','bw');
to create a structure with the field names 'bounds' and 'linestylemap'
having the values 'tight' and
'bw', respectively. You can now type
previewfig(gcf, opts);
instead of
previewfig(gcf,'bounds','tight','linestylemap','bw');
Also, if you type in R12
setpref('exportfig','defaults',opts);
then opts will be used as the default options for all of
the exportfig functions and so you can simply
type
previewfig(gcf);
The options specified in setpref are stored in your
preferences file and will be automatically used
in future MATLAB sessions.
The final new feature of exportfig is the ability to export bitmap images to one
file and vectorformat
text to another file. In our example of plotting sin and cosine this feature is
not needed since
the entire plot can be rendered in a vector format. But some plots, like those
involving
transparency, can only be rendered in a bitmap format, and so the text would
become pixelized and
hard to read. The command:
exportfig(gcf,'test.eps','separatetext',1);
will create two files : test.eps and test_t.eps. The first
file contains exactly what exportfig
would normally produce except that all the text has been hidden. The second file
contains only the
text. You must overlay the two pictures in the destination document to obtain
the true image. For
example, to overlay two EPS files test.eps and test_t.eps that are 3 inches high
you could
use the TeX commands
\includegraphics{test.eps}
\vskip -3in
\includegraphics{test_t.eps}
Using this technique the text is drawn at the printer's
resolution and so it produces much higher
quality images than could be produced using bitmaps alone.
These are only the most important new features of exportfig family. For more
details about the
capabilities of exportfig.m, type
help exportfig
to read the function?s documentation.


