Objectives:
1. To graph:
a. Power functions
b. Root functions
c. Reciprocal Functions
d. Piecewise functions
2. To model:
a. Quadratic functions
b. Power functions
3. To compare models .
Power Function
is a function of the form y = axb, where a
and b are real numbers and b ≠0.
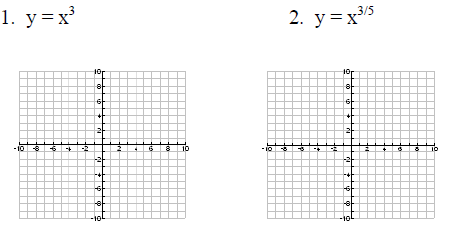
Example: Graph each equation on [-10, 10] by [-10,10]

EXAMPLE #36 The percent of all families that were
single-
parent families after 1960 was found to be modeled by
y = 1.053x0.888, with x = 0 in 1950.
a. What is f(45)? What does this mean?
b. Does this model indicate that the percent of single
families increased or
decreased during this period after
1960?
Root Functionnax a function of the form y = ax1/n or y =
 ,
,
where n is an
integer, n ≥ 2.
The graphs of these functions increase in the first quadrant but not as fast as
y = x does for values of x greater that 1, so we say that they are concave
down
in the first quadrant.
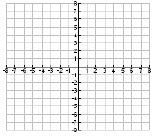
Graph y =  +on [-8,8] by[-8,8]

Reciprocal Function

Graph  on [-8,8] by[-8,8] (asymptote)

EXAMPLE #52 The monthly average cost of producing
27-inche
television sets is  dollars, where x
is the
number of sets produced per month. What is the
average cost per set if 2000 sets
are produced?
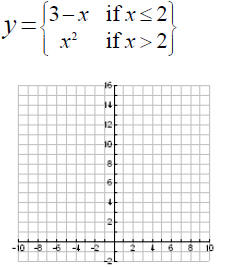
Piecewise-Defined Function

Graph

2.

EXAMPLE #42 The federal on-budget funds for all
educational programs (in millions of constant 2000 dollars)
between 1965 and
2000 can be modeled by the function
 where t is
the
number of years after 1960.
a. Graph the function for 5 ≤ t ≤ 40. Describe how
the funding for educational
programs varied between
1965 and 2000.
b. What was the amount of funding for educational
programs in 1980?
c. How much federal funding was allotted for
educational programs in 1998?
Solving Absolute Value Equations
If  and a > 0, then x = a or x = -a. There is no
solution to  = a if a < 0. V
= 0 has solution x = 0.
Solve

Now let’s graph quadratic and power models with our
calculator .
Modeling with Quadratic Functions
Example: Use the following table to answer questions.

a. Create a quadratic function that models the data. We
will do this just like a linear regression but we will use
QuadReg.
a. Enter the data into List 1 and list 2
b. Then use Stat-cal #5
c. Paste the function
b. Graph the aligned data and the quadratic function on the
same axes. Does this model seem like a reasonable fit?
We can compare Linear and Quadratic Models by finding
the differences of the y
values when the x differences are
constant.
Linear- First differences are fairly constant
Quadratic-Second differences are fairly constant
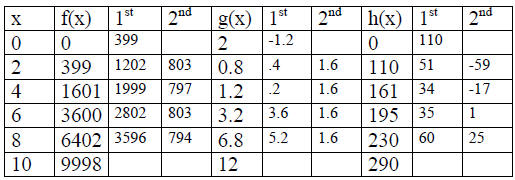
Example: #4 The following table has the inputs, x, and the
outputs for three functions, f, g, and h. Use the second
difference to determine
which function is exactly quadratic,
approximately quadratic or not quadratic.

Example #18The percent of unemployment in the US for
the
years 2000-2007 is given by the data in the table below.
a. Create a scatter plot for the data , with x equal to the
number of years after
2000.
b. Does it appear that a quadratic model will fit the data? If
so, find the
best-fitting quadratic model.
c. Does the y intercept of the function on part (b) have meaning in
the context
of this problem? If so, interrept the value.
| Year |
Percent
unemployment |
Year |
Percent
unemployment |
 |
Modeling with Powers (y = axb)
Example #35 The global spending on travel and tourism (in
billions of dollars)
for the years 1991-2005 is given in the
table below.
a. Write the equation of a power function that models the
data, letting your
input represent the number of years after
1990.
b. Use the model to estimate the global spending for 2010.
c. When did the global spending reach $300 billion,
according to this model?
| Year |
Spending |
Year |
Spending |
Year |
Spending |
 |
Comparison of Power and Quadratic Models
If data points appear to rise (or fall) more rapidly than a line, then a
quadratic or power model may fit the data well.
Creating both models and comparing may be appropriate.
Sometimes the addition of another data point may clarify
the best model.
Homework Course Compass Sections 3.3 and 3.4.
Bookwork page 213 #12, 14, 20 none from 3.4 and do the
Piece Wise supplement


