Review graphing inequalities on a number line
Core Concepts:
→ Scatter diagrams and line graphs
• Remember tables and bar charts. We can translate the
information from a bar chart or
table into a scatter diagram and line graph. Let’s use the data we can create by
figuring
out how much money Billy would get by mowing the lawn a set number of times . If
Billy gets $2.00 each time he mows the lawn, then we can develop a formula to
see how
much money he gets if he mows the lawn “x” times:
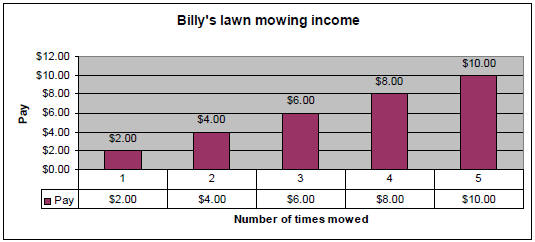
• Build a table and bar chart that shows how much he gets
for doing the lawn from 1 to 5
times:

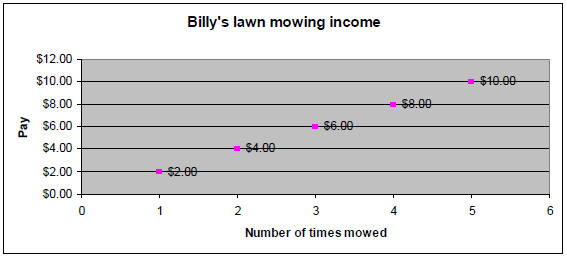
• Scatter diagram: Just dots on a graph that represent the information in the
table or bar
chart.

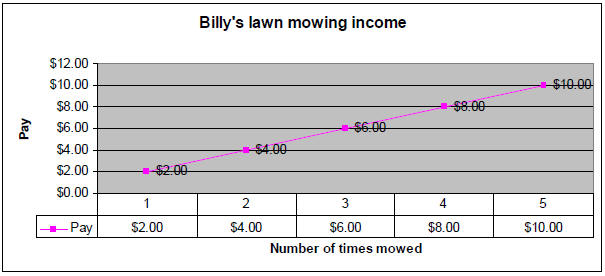
• Line graph: Connect the dots in a scatter diagram with a straight line.
Billy's lawn mowing income

→ Ordered Pairs : When we have a table like the ones above,
we call the corresponding
numbers “Ordered Pairs” and we can write each pair in parenthesis separated by a
comma
like so: (1,2) (2,3) (3,6) (4,8)…
• So the definition of an ordered pair is a pair of
numbers enclosed in parentheses and
separated by a comma. The first number is called the x- coordinate and the second
number is called the y-coordinate.
→ Our graph above didn’t have a spot to graph if Billy
lost money (or negative numbers ), and
in real life – this could happen, so we want a system where we can graph both.
We didn’t
include in the problem Billy’s costs for gas and repairs:
→ We graph these ordered pairs on the “rectangular
coordinate system”
• It is built from two number lines oriented perpendicular
to each other. (Draw the
coordinate system on the board and label as you speak)
• Horizontal line is called the x-axis. And just like our
regular number line, right is
positive and left is negative.
• Vertical line is called the y-axis. In this case, since
the line goes up and down, up is
positive and down is negative.
• The point where the two lines meet is called the origin.
• The system has four parts or quadrants which are labeled
with the roman numerals I to
IV in a counterclockwise direction. (talk about the signs of the ordered pairs
in ea.
Quadrant)
→ Graphing ordered pairs: To graph an ordered pair, we
simply start at the origin and count
over on the x-axis to the first number (the x-coordinate), then up or down from
there to the
next number (y-coordinate). We place a dot at that intersection to represent the
ordered
pair.
• Do some examples: (3,4), (-2,1), (-4,-3), (1, -2)
• We can connect the dots and tell if we have a linear
system or not.
• Do the coordinates we just graphed make up a linear system? No
• We can also tell if any other points lie on the line we
drew. (DO BELOW AS
INDIVIDUAL WORK, THEN GET BACK TOGETHER TO DISCUSS).
• EX: graph (4,3) and (-4,-1) and draw a straight line
that passes through both of them.
Does the graph of (-2,0) lie on the line? yes; How about (-3,2)? no
→ Let’s look at some ways to look at other geometry like
squares and rectangles
• If we have a square with sides 4 units long and the bottom right corner starts
at (2,-3), we
can graph the other coordinates.
• We know the bottom right corner starts at (2,-3), so we
can count up (or add 4 to y -coordinate)
four points to get to the top right corner, (2,1); Then from there go left (or
in
the negative x direction) 4 spaces to get the top left corner, (-2,1); From
there go down
(or in the negative y direction) 4 spaces to get the bottom left corner (or add
-4 to the y-coordinate),
(-2,-3).
• We know we can do the same thing with any rectangle as
long as we know how long the
sides are. Ask them to do the same on their paper with a square whose sides are
2 and
the top left corner starts at (-1,1). ANSWER clockwise: (1,1),(1,-1), (-1,-1)
Solutions to Linear Equations in two variables
→ Review solving equations in one variable
• If we solve equations in one variable, we get one
answer, which is the solution set. We
can graph this on a number line.
• EX: Graph the solution on a number line.
• We can graph inequalities in one variable on a standard
number line as well:
• EX:  Graph the solution on a number line.
→ In a linear equation in two variables, the solution will
not be one number; it will be a pair
of numbers, one for each variable. We can’t graph this on the number line
because there are
two variables, not one. So we need the rectangular coordinate system to picture
our
answers.
• EX: 
• One pair of numbers that works is  and
and
 because when we substitute
them, we get a true statement:

The pair of numbers above can be written as an ordered
pair: (2,-1). Because the first
number is associated with the variable x and the second with y.
• The ordered pair (2, -1) is not the only solution to the
above equation. Another solution
is (0, 3). Plug it in and tell me if it works.
• We can plug in any number for x and find a corresponding
y that will be make the
equation true. An infinite number of ordered pairs will satisfy the equation.
• We can find any number of pairs by plugging in a value
for either variable and solving
for the other variable.
• EX: Let’s plug in the following numbers for the variables in
 and find the
corresponding x or y value that satisfies the equation:

ANSWER: 
• We can plot these coordinate on the rectangular
coordinate system. Do these
coordinates make a straight line? Yes, then it is a linear equation (hence the
name
“linear” – because the solutions draw a line).
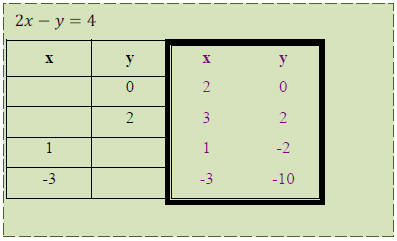
• Class work: Build a table and fill in for the following
equation:

You can see from the above that for any formula with two
variables, we can find the solution set
by plugging a number in for one of the variables.
→ Mixed Classwork:
| a) Plot the following ordered pairs: (-3,0) (4,3)
(2, -2), 0,5) b) In which quadrant or axis
will the following ordered
pairs be?
c) Complete the table for the equation:

|


