Objectives:
• to introduce basic tools of the Maple software
• to understand the difference between a function and an expression (Section
1.1)
• to learn how to plot functions in Maple (Section 1.4)
• to introduce piecewise functions (Section 1.1)
• to examine transformations of functions (Section 1.3)
• to look for symmetry in functions (Section 1.1)
• to understand composition of functions (Section 1.3)
Maple 10 is a powerful software package for doing mathematics. Many of the
buttons at the top will be
familiar from other software, but some will be new. On the left are a series of
pallettes full of mathematical
symbols. You can click on the symbol you want for calculations or for typing
text.
Notice on the left two buttons marked “Text” and “Math”. When you want to write
something—like a
caption or an explanation—you should use “Text”. Your lab homework should have
some text in it: the
names of your group members, the assignment number, the date, the numbers of the
activities, etc. You can
get fancy with fonts too.
When you want to calculate or plot something, use “Math”. You can construct your
calculation commands
with the symbol pallettes or with written commands.
Maple is case-sensitive. This means that lower and upper case letters stand for
different values. For instance,
Maple considers f and F to be different things .
Maple can work in exact arithmetic or in floating point arithmetic. Floating
point means decimal approximations.
If there are decimal points in a calculation or if you ask for evalf, you will
get floating point
answers.
Activities
1. This activity will let you practice with some basic Maple operations .
(a) Do the following calculations, one at a time:
• (You can use the command sqrt or you can
use
  from the Expression pallette .)
• evalf(%) (The percentage sign % tells Maple to use the result of the previous
calculation .)
•
• evalf(%)
•  Give an exact answer and a floating point
answer.
(b) Create a function f := x → 2x2 − 3x + 4. (To get the exponent, type xˆ2,
then use the right
arrow to get out of the exponent .) Calculate the following, and simplify if
needed:
f(2), f(−2), f(a), f(−a), f(a + 1), f(2a), f(a + h)
(To simplify a result , use the command simplify(%).)
2. In Maple, you must be alert to the difference between
an expression and a function defined by an
expression. For example, there are some important differences between the
following:
f := 2x2 − x − 15 This is an expression.
F := x → 2x2 − x − 15 This is a function.
(a) Define f and F in Maple. Then try these commands.
factor (f)
factor (F)
solve (f = 0, x)
solve (F = 0, x)
solve (f(x) = 0, x)
solve (F(x) = 0, x)
fsolve (f = 0, x)
(b) Repeat part (a) for the expression g := 2x2 − 2x − 15 and the function G :=
x → 2x2 − 2x − 15.
(c) Explain the difference between an expression and a function in Maple.
(d) Explain the difference between solve and fsolve .
3. In this activity you will use the plot command to create graphs of functions .
(a) In Maple, define the function
(b) Run the command plot(f(x), x = −5..5).
(c) If you click on the graph, several buttons will appear above the workspace.
You can use these to
change the axes or to apply a grid. The 1 : 1 button sets the vertical and
horizontal scales equal,
to remove any skew in the picture. Experiment with these buttons.
(d) Adjust the x and y ranges of your graph to show only the portion of this
curve for which 3.7 ≤
y ≤3.8.
4. Here is a piecewise defined function.

In Maple, this can be written as h := x → piecewise

(a) Define the function h in Maple. Create a plot of this function. Explain why
the picture is not
entirely correct.
(b) Change the value 1 to a new value that makes this function one continuous
graph. Plot your new
function.
5. Define the function g := x → x2 in Maple.
(a) Plot g(x), g(x)+1, g(x+1), −g(x), g(−x),
 , and
, and  on one set of axes. Print your graph
and label each curve.
Maple hint: To plot a set of functions use the command
plot( { your list of functions }, x=starting value .. ending value ).
(b) Repeat part (a) for the function sin(x).
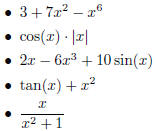
6. For each of the functions listed below, calculate f(−x)
and −f(x). Decide whether f(x) = f(−x),
f(x) = −f(x), or neither. (You can do this with Maple or by hand.)

7. (a) A function for which f(−x) = f(x) is called an even
function. You should have found two even
functions in Activity 6. Plot these two functions. What is special about the
graphs of even
functions?
(b) A function for which f(−x) = −f(x) is called an odd function. You should
have found two
odd functions in Activity 6. Plot these two functions. What is special about the
graphs of odd
functions?
8. In Maple, define the two functions

(a) Compute F(G(x)) and G(F(x)). Are these equal?
(b) Compute (F o G)(x) and (G o F)(x). (The symbol o is in the Common Symbols pallette.) Are
these equal? Are they equal to the results in part (a)?
(c) Now compute (G o G)(x) and simplify the result. Does (G o G) equal G?


