Agenda for Today
•Homework Questions
•Homework #4 due today
•Homework #5 due 10/15
•Review to §3.5
•§3.6 Inverse Functions
•§4.1 Linear Functions
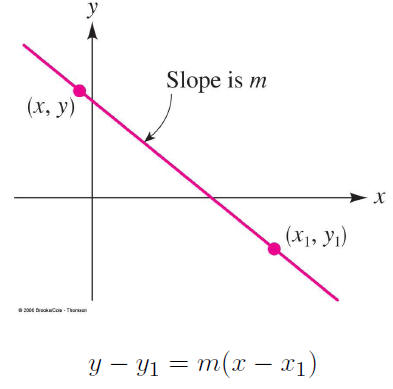
Another way to specify all the points is with a starting
point
on the plane and a slope from that point.
This section deals with quadratic equations, which are of
the form

There are three ways to solve these equations:
1. Factor This is easy , but does not always work.
2. Complete the Square This is hard, but always works.
3. The Quadratic Formula A shortcut, always works.

Review: Functions
A Relation is any way to take an x and find a y.
A Function is a relation where each x produces one, and
only one, y.
The Domain of a function are all of the x’s that are allowed
to be used.
The Range of a function are all the possible y’s that could
come out.
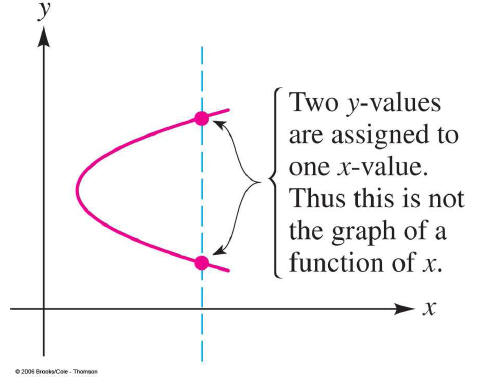
If a graph represents a function, it will pass the
vertical line
test.
Review: Finding the Domain
When you are fining the domain of a function, there are 2
possible problems:
1. You can’t divide by zero .
2. You can’t take the square root of a negative number.
So the domain of f(x) = 1/x is R except 0.
The domain of  is
non- negative elements of R
Review: Finding the Range
To determine the range of a function, say y = x^2, solve
for x.

For what y’s can you find x’s?
In this case, you can find x’s only for y’s bigger than or
equal to 0, so the range is all non-negative numbers in R .
We will learn an easier way to find the range in the next
section.
What is the range of

Review: Graphing→Domain, Range
Simply scan across to find the values where the function
is
not defined at x. This is the domain.
Then scan up to find the values where the function is not
defined at y. This is the range.
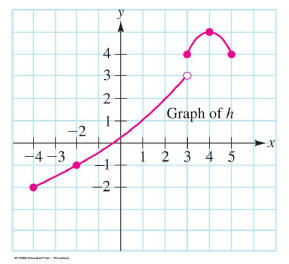
So the domain is [-4,5] and the range is [-2,3) with
[4,5].
Review: Rates of Change
The average rate of change between a and b for a function
f(x) is
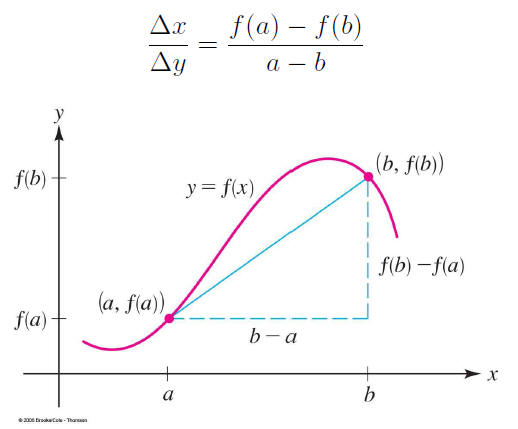
The average rate of change between x and x + h when h is
small will be very close to the actual rate of change at x

Review: Transformations
Most graphs are translations of easy graphs that we know.
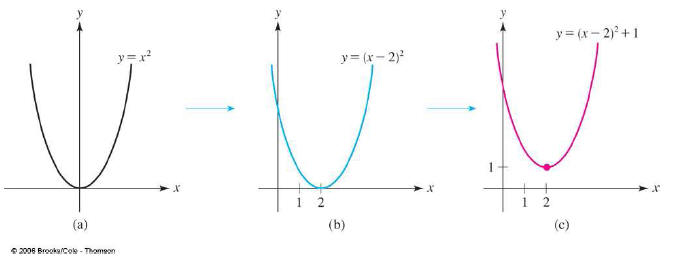
Review: Effects of Transformations

•A > 0 “scales” the graph

•“scales” could be “stretching” (A > 1) or “squashing” (0 < A < 1)
•A < 0 “scales” the graph after “flipping” it over the x-axis.
•B > 0 “scales” the graph ↔
•B < 0 “scales” the graph after “flipping” it over the y-axis.
•h “shifts” the graph ↔
•k “shifts” the graph

§3.5 Iteration
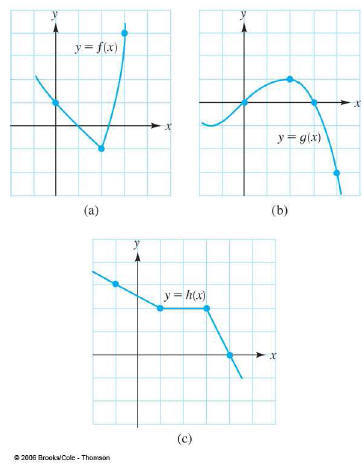
Function iteration is just applying functions in sequence.
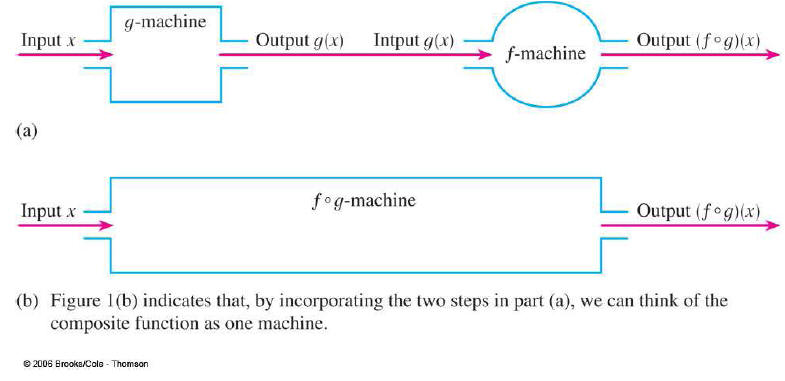
Iteration Example
§3.6: Inverse Functions
An inverse function for f, usually written f−1, is the function
that asks the question, “What do I put into f to get y out?”
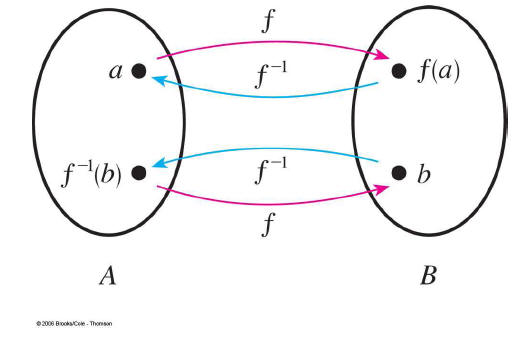
Finding inverse relations with Graphs
To find an inverse relationship, it should be clear that
you
switch the domain, x, with the range, y.
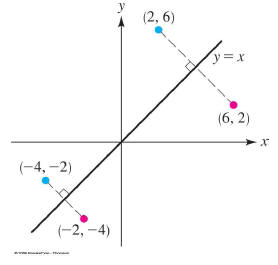
It is clear that this new graph is a “flip” across the
line y = x.
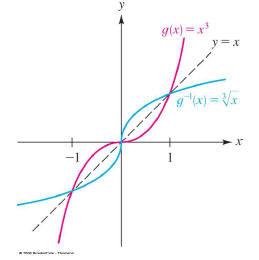
Inverse Graphs #2
Because switching the domain, x, with the range, y is a
“flip”
over y = x we have:
Horizontal Line Test
If a function does not pass the “Horizontal line test”
what
can you say about its inverse?
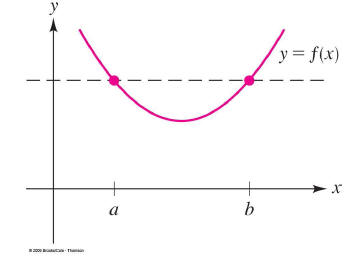
Definition: “One-to-One”
A function f is “one-to-one” if each y has only one x
where
f(x) = y.
How does this relate to the Horizontal line test and the
inverse of f?
Answer:
A function has an inverse function if and only if it is
one-to-one.
To find an inverse function algebraically, write the
function
with an x and y
f(x) = 3x − 1 -> y = 3x − 1
Then switch the x and y to get
x = 3y − 1,
and now solve for y to get

Therefore

§4.1 Linear Functions
A linear function is a function where
f(x) = Ax + B
and A,B are real numbers.
These functions are basically lines in slope- intercept form !
Linear Regression
Linear Regression is when we “fit” a linear function to
some
data.
There are many sophisticated statistical methods for
finding
the best line, but in this class we are just going to eyeball it!
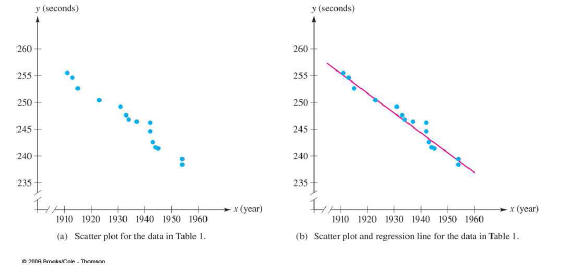
What would the linear function be in this case?
Issues with Linear Regression
Now that we have the linear function, we can guess what
the values will be in, say, 1928.
f(1928) =
What would happen if we used our function to guess what
happens in 2100?


