This is a handout that will help you systematically sketch
functions on a coordinate
plane. This handout also contains definitions of relevant terms needed for curve
sketching. Another handout available on the handouts wall has 3 sample problems
worked out completely.
ASYMPTOTES:
This handout will discuss three kinds of asymptotes: vertical, horizontal, and
slant.
VERTICAL ASYMPTOTES
We define the line  as a vertical
asymptote of the graph of
  iff (if and
only if)
 approaches infinity as x approaches c from the
right or left.
The concept of an asymptote is best illustrated in the following example:
Take the function 
Here, we can see that x cannot take the value of 1,
otherwise,  would be undefined.
Also:
 and
and 
In this case, we call the line
 a vertical asymptote of
 .
.
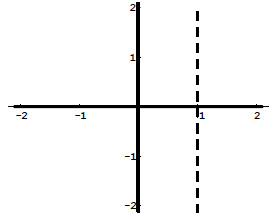 |
Vertical Asymptote:
 |
The fact that  is
undefined at
  is not
enough to conclude that we have a
vertical asymptote. The function must also approach infinity or negative
infinity as
x approaches the value at which  is
undefined.
Consider the following problem:

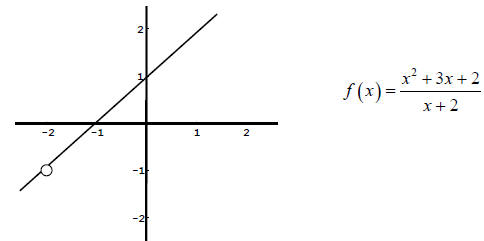
The function  is undefined at
 but we do not have an asymptote. Notice
the
following:

We conclude that  approaches -1 as x approaches -2.
This function has a "hole"
(removable discontinuity), not an asymptote, at the
value for which  is undefined.
In general, you may note that a rational function (a
function that is the quotient of two
polynomial functions), that is fully
reduced (the numerator and denominator cannot
be factored such that they share a
common factor which can be “cancelled”) will have a
vertical asymptote at each
x-value that causes the denominator to evaluate to zero .
Once again, in order to have an asymptote at
 ,
,  must have a
discontinuity at
c and  f must approach positive or negative infinity, as x approaches c from the
left or the right.
HORIZONTAL ASYMPTOTES
We define the line  as a horizontal asymptote
of the graph of
 iff
iff 
approaches L as x approaches infinity.
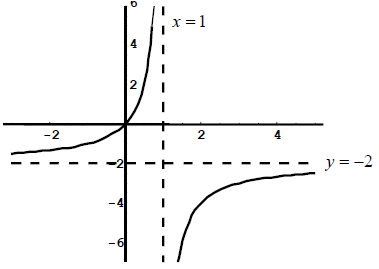
For the function  the line
  is the horizontal asymptote of the graph of
 .
.
The following limit shows why this is true:
 and
and

When x approaches infinity,  approaches the line
 ,
and when x approaches
negative infinity,  also approaches the line
 .
.
A quick way to determine the position of the horizontal
asymptote of a rational function
(having no common factors) is with the
following method . Look at the highest degree in
the numerator and the highest
degree in the denominator.
• If the highest degree is in the denominator, then the horizontal asymptote is
.

• If the highest degree in the numerator and the highest degree in the
denominator are equal, then the horizontal asymptote is the ratio of the
coefficient of the highest degree term in the numerator to the coefficient of
the
highest degree term in the denominator. (In our previous example,
 ,
the
,
the
highest degree in the numerator is 1 and the highest degree in the
denominator
is 1. The ratio of highest degree term coefficients is
 . So the
horizontal
asymptote is  .)
.)
• If the highest degree in the numerator is one degree larger than the highest
degree in the denominator, then the function has a slant asymptote.
• If the highest degree in the numerator is more than one degree larger than the
highest degree in the denominator, then the function has no horizontal or slant
asymptote.
SLANT ASYMPTOTES
If the highest degree in the numerator of a rational function (having no common
factors) is
one degree larger than the highest degree in the denominator, we say
that the function has
a slant asymptote.
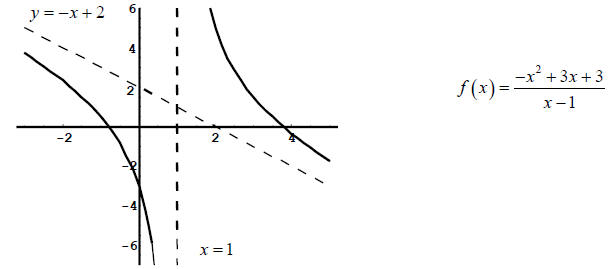
To determine the asymptote, rewrite the function in terms of a polynomial +
another rational
function. For example, let

Dividing the numerator by
 (see “Synthetic Division”
handout), we get

Since the fraction  approaches 0 as x approaches
infinity and negative infinity, the
function  approaches the line
 as x
approaches infinity and negative infinity.
 is called a slant asymptote
Some Remarks about Functions with Asymptotes:
• Vertical asymptotes are NEVER crossed by . However,
the graph of  may
sometimes cross a horizontal or slant
asymptote.
• Asymptotes help determine the shape of the graph.
• Polynomial functions never have asymptotes.
INCREASING AND DECREASING:
A function is increasing over an interval if, when tracing the graph from
left
to right, the graph is going up. Likewise , a function is decreasing
over an
interval when the graph is going down (when tracing the graph
from left to
right).
Mathematically , the function is increasing when
 (the slope
of the
tangent line to the curve) is positive and is
decreasing
when  is
negative.
A function  can change from increasing to decreasing
(or vice
versa) at values where  or
or is undefined.
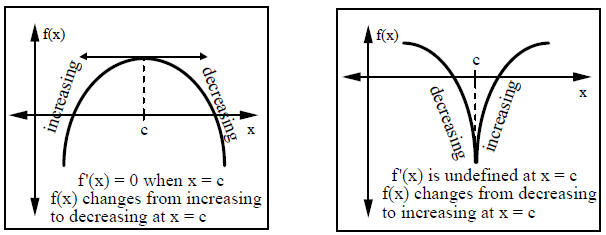
To find where a function is increasing and where it is
decreasing:
1. Compute .
.
2. Determine the value(s) of x where or where
 is undefined.
3. Order the values found in (2) in increasing order and plot them on a number
line .
4. For every interval between two consecutive values in (3), choose a test value
in
that interval.
5. Determine the value of at the test value.
6. If  at the test value, then
 is increasing on that interval. If

at the test value, then is decreasing on that interval.
For example: Let  . Determine where
  is
increasing and where it is
decreasing.
Taking the first derivative and setting it equal to zero, we obtain:

 is defined everywhere, so we have only 2 values where
 can change from
increasing to decreasing:
 and
and
 .
.
Order the values found above on a number line as follows:

The intervals we need to test are (-∞,-1), (-1,1) and
(1,∞):
A) For the interval (-∞,-1), we will choose  as our test value.

Since  , we know
  is
increasing on the interval (-∞,-1).
B) For the interval (-1,1), we choose  as our
test value.

Therefore, since  ,
,  is
decreasing on the interval (-1,1).
C) For the interval (1,∞), we choose  as our
test value.

Again,  is increasing on the interval (1,∞), because
 .
.
Relabeling our number line we have the following:

Remember that values where
 or
or
 is undefined
are only potential places
where the graph can change from increasing to
decreasing (or vice versa). It is
possible, however, that the function may not
change at those values.


