6. The use of automatic teller machines is continuing a steady growth in the
U.S.
Using data from the mid-1990’s (from the August 31, 1997, Cincinnati Enquirer),
a model tracking the annual number of transactions at ATMs nationwide (in
millions) is given by A(t) = 61.4t + 521.9 where t measures the number of years
since 1990. The same report yields the model formula p (t) = 0.0065t2 – 0.0553t +
0.682 for the percentage of ATM transactions in which customers withdrew cash
from their accounts.
(a) [5 points] Calculate A (5) and p(5) and interpret these numbers.
A(5) = 61.4 · 5 + 521.9 = 828.9 million transactions at ATMs in 1995
p(5) = 0.0065 · 52 – 0.0553 · 5 + 0.682 = .568 = 56.8% of ATM transactions were
cash
withdrawals in 1995
(b) [10 points] Let f(t) = A(t)·p(t) be the function obtained by multiplying the
functions A and p. What does the function f(t) measure? Calculate and
interpret the value of f (5).
f(t) = # of transactions at ATMs nationwide (in millions) which were cash
withdrawals.
Therefore, f(5) = 470.8 million ATM transactions in 1995 were cash withdrawals.
This is the second form of the test.
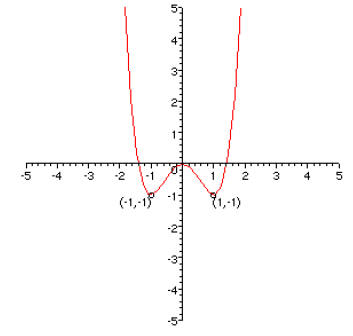
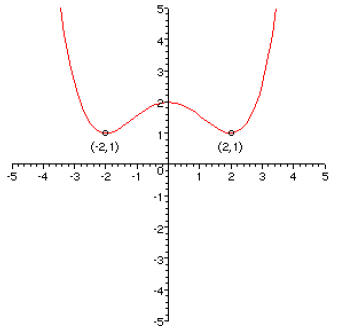
1. [20 points] On the axes on the left, graph the function f(x) = x4 – 2x2.
Label the
coordinates of the points on the graph at x = ±1. Then on the axes on the right,
graph the transformed function g(x) = f(0.5x) + 2 and label the corresponding
points on this curve .
2. [15 points] The practices of fishermen worldwide has
been a concern of
environmentalists for years. Data from the early 1990’s yields the following
quadratic function as a model for the size of catches of fish (in millions of
metric
tons) measured in year t after 1990: F(t) = 1.155t2 – 1.743t + 97.462. For
instance, in 1993, total world catches of fish amounted to F(3) = 102.6 million
metric tons. Find the vertex of the parabola which is the graph of the function
F(t) and explain what it tells us about world fishing.
The vertex has x-coordinate h = –b/2a = –(–1.743)/(2*1.155) = .75 and
y-coordinate k
= B(h) = 96.804. So the vertex is the point (.75, 96.8). This means that .75
years after
1990 (by 1991) 96.8 million metric tons were fished worldwide, representing a
minimum value, and (since a = 1.155 is positive ) this total has been growing
ever
since.
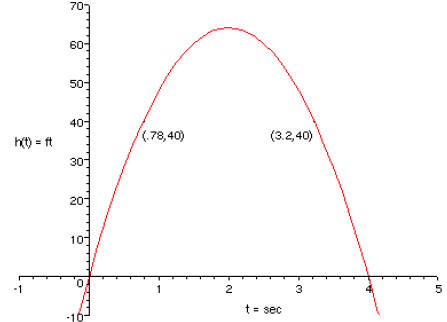
3. [15 points] A ball is thrown into the air. Its height in feet t seconds later
is given
by the equation h (t) = 64t – 16t2. Solve the equation h(t) = 40. Interpret your
solutions and illustrate them on a graph of h(t).
We solve:
40 = 64t – 16t2
16t2 – 64t + 40 = 0
2t2 – 8t + 5 = 0
(quadratic formula:) 
So the ball reaches a height of 40 ft twice: on the way up at t = .78 sec, and
on the way
down at t = 3.2 sec.
4. a) [10 points] If  ,
find possible formulas for u(x) and v(x).
There are many ways to answer this problem. Here are two different correct
answers:
 and v(x) = x2 + 1; or
 and
and  .
.
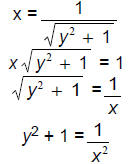
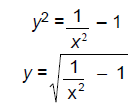
(b) [10 points] Give a formula for w-1(x).
An equation for the inverse will reverse the roles of input and output, and
solve for y :
5. [15 points] Complete the table.
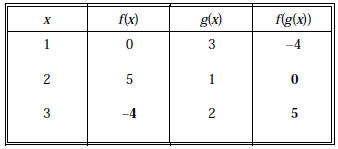
Here’s why: f(g(2)) = f(1) = 0; f(3) = f(g(1)) = –4;
f(g(3)) = f(2) = 5.
6. [10 points] Census figures for the early 1990’s give data on the populations
of
each of the 50 states. The following exponential models give population
functions
for the states of Ohio, Kentucky and Indiana (where t measures years since 1990,
and populations are measured in thousands):

(a) Determine the populations of each of the three states in 2001, based on
these
models. Also give the total population of the tristate area in 2001.
The population of Ohio in 2001 is  = 11466.319 thousand = 11,466,319
The population of Kentucky in 2001 is  = 4068.225 thousand = 4,068,225
The population of Indiana in 2001 is  = 6106.421 thousand = 6,106,421
So the total population of the tristate is 21,640,965.
(b) Write a formula for the function P(t) which gives the total tristate
population
in year t. Calculate and interpret the quantity P(11).

From this we find that the total population of the Tristate is
P(11) = 21640.965 thousand = 21,640,965.


