You may find the following formulas helpful to answer some
of the sample questions

1. Use the following lines to answer problems 1a - 1d.

1a. Which lines have positive slope ?
1b. Which lines have negative slope ?
1c. Which lines have zero slope ?
1d. Which lines have undefined slope?
2. In problems 2a - 2d, classify each number. Circle all
correct answers.
2a.  : (i) natural
number (ii) integer (iii) rational number (iv) real number
2b. -3 : (i) natural number (ii) integer (iii) rational number (iv) real number
2c. 4.55: (i) natural number (ii) integer (iii) rational number (iv) real number
2d.  : (i) natural number (ii) integer (iii)
rational number (iv) real number
3. Circle the correct answer in problems 3a and 3b. For
each measured quantity, state the set of numbers that
is most appropriate to describe it. (There is one correct answer for each
problem.)
3a. Attendance at a basketball game: (i) natural number
(ii) integer (iii) rational number (iv) real number
3b. Price of a cup of coffee:
(i) natural number (ii) integer (iii) rational number (iv)
real number
4. Rewrite each real number using exponents.

5. Rewrite the real number without using negative
exponents or decimals :

6. Rewrite the real number without using fractions or
decimals :

7. Fill in the blanks: If
 , then the point (_____, _____) lies on the
graph of f .
8. Use the following table to answer problems 8a - 8d.
This table shows the number of millions of acres of
Texas cropland (y), from 1966 to 2006.

8a. How much cropland was there in 1986? ___acres
8b. What was the minimum amount cropland during this time
period? ___ acres The
maximum? ___ acres
8c. Choose an appropriate viewing window for a scatter
plot of this data . Answers may vary.

8d. Find the percent change in Texas cropland from 1966 to
2006. Interpret your answer
9. An actuary set up the following table for an insurance
company that relates the expenses (in thousands of
dollars) for hospital patients and the number of days of hospitalization. For
this study, the actuary randomly
chose the records of 8 patients, each of whom was hospitalized for the same
medical procedure.

9a. Does this table represent a function? Yes ___ No ___
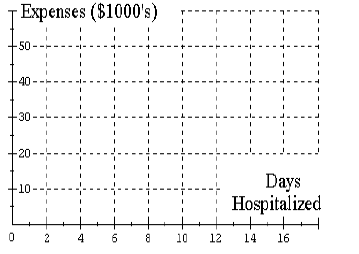
9b. What is the graphing window shown at the right?

9c. Make a scatter plot of this table on the set of axes
shown at the right.
10. On average, the size S of a child's vocabulary,
measured in thousands of words, is a function of his or
her age x.
10a. Express the following information in function
notation: A 3-year-old has an average vocabulary of
2,500 words.
10b. What is the practical meaning of the expression
 ?
?
11. Use the function f(x) to answer problems 11a - 11b:
 . Show your work.
11a. Evaluate  . If not
possible, write undefined.
11b. Write the domain of the function f.
12. Use the function f(x) to answer problems 12a - 12b:
 Show your work.
12a. Evaluate f(1). If not possible, write undefined.
12b. Write the domain of the function f.
13. Use the function f(x) to answer problems 13a - 13b:
 . Show your work.
13a. Evaluate f(2). If not possible, write undefined.
13b. Write the domain of the function f.
14. Use the function f(x) to answer problems 14a - 14b:
 . Show your work.
14a. Evaluate and simplify :
14b. Write the domain of the function f.
15. A car that is currently 50 miles from Houston is
traveling on the freeway at a speed of 70 miles per hour.
Let y be the car's distance from Houston after x hours. Write a formula for this
function.

16. A particular laptop computer that costs $2,000 new is
projected to lose $100 in resale value each month .
Let V be the resale value after t months. Write a formula for this function.

17. Consider the following function.

Without graphing, is this function linear? ___ Yes ___ No
Explain your answer.
If it is linear, find the slope.
18. The following table shows the number of restrooms y
required at a worksite that employs x persons.

Without graphing, is this function linear? ___ Yes ___ No
Explain your answer.
If it is linear, find the slope.
19. Consider the following function:

Without graphing, is this function linear? ___ Yes ___ No
Explain your answer.
If it is linear, find the slope.

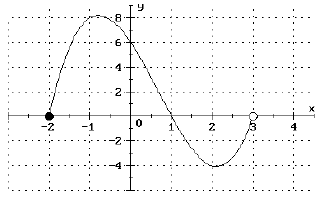
20. Use the graph of the function g shown here
to answer the following questions 20a - 20c.
20a. Evaluate:

20b. Find all values x such that

20c. Write the domain of the function g.
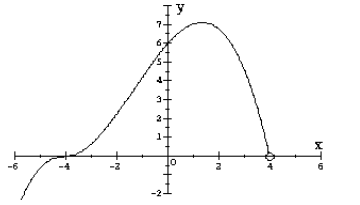
21. Use the graph of the function p shown here
to answer the following questions 
21a. Evaluate: 
21b. Find all values x such that

21c. Write the domain of the function p.
22. Find the slope of the line containing the points
 . Show your work.

23. Find the slope of the line containing the points
 . Show your work.

24. For each relation given in 24a - 24b, determine if it
is a function. Check the correct answer and justify.
24a. 
Is this relation a function? ___ Yes ___ No
Explain your answer.
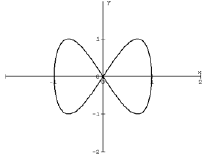
Is this relation a function? ___ Yes ___ No
Explain your answer. Do not use the phrase “vertical line test.”
25. In problems 25a - 25b, write the slope and y- intercept
of each line .

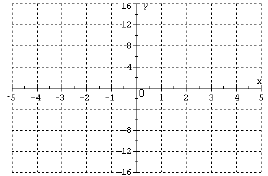
25c. Graph the function  on the set
of axes shown here.
25d. Write the domain of the function

26. Use the function  to evaluate the following expressions:

27. Due to urbanization, the deer population in Dry Gulch
County has been steadily decreasing since 1970.
Scientists have determined the following linear function that relates the number
of deer (d) to the elapsed
time in years since 1970 (t).

27a. What is the practical meaning of the expression
 ? Do not evaluate.
27b. Express the following information in function
notation: The deer population is projected to be 3,000 in
2010.
27c. What is the y-intercept of this function? y-int. Interpret this value in the context of the
problem.
27d. What is the slope of this function?
 Interpret this value in the context of the
problem.
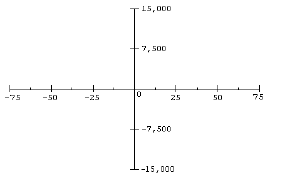
27e. Sketch a graph of the function d on the set of axes
shown here. Be sure your graph indicates the correct
domain.
28Þ The following table shows the typical age at first
marriage for females in the U.S., from 1950 to 2000.
What is the y-intercept of this function?


