Situation: Directing a Movie. The director
of a movie needs to make a
variety of decisions when a film clip should start, what is the best
timing for
two concurrent events, and how to stage things to maximize excitement
while ensuring safety. Decisions like this depend on timing governed by
mathematical relationships . |
Exploration I: Compositions for a Movie Scene
Situation: Dropping off a Cliff. The real
power of composition comes
from its ability to take simple functions and use them to build new
families
of functions. Composition also provides a tool for modeling complicated
situations.
In this and the next exploration, a movie director is making decisions
about
the timing and location of events on a movie set. The first scene
requiring
this type of decision is one in which a car is to speed over a cliff.
Many of
different locations have been scouted out, and the director has a list
of these
different cliffs, together with the time it would take the car to fall
to the
bottom of each cliff.
| Location |
Time |
| Canyon Drive |
5.2 sec |
| Overlook Heights |
4.1 sec |
| Alta Vista |
4.8 sec |
| Chasm Canyon |
6.5 sec |
| Rocky Ravine |
3.3 sec |
| Mount Dropmore |
7.3 sec |
| Riveredge Bluff |
5.6 sec |
|
The director is concerned that the fall may not last long
enough for the full
panning shot that she wants. It is possible to construct a ramp on the top of
the
cliff, hidden from the camera, that would add ten meters to the distance the car
has to fall. The general arrangement of the ramp is shown in the following
diagram.
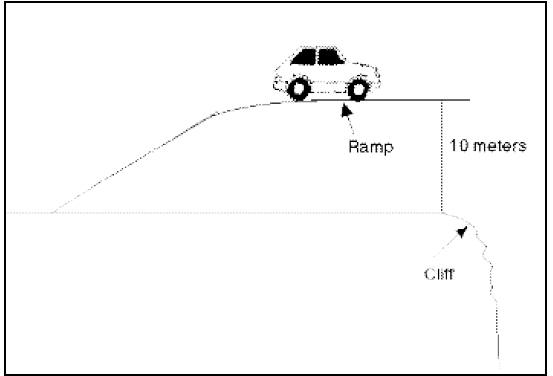
The director wants to find out how long it would take for
the car to fall down
each of these cliffs if the ramp were put in. What she wants is a function whose
input is the time it will take for the car to fall if there is no ramp, and
whose
output is the time it will take for the car to fall if there is a ramp.
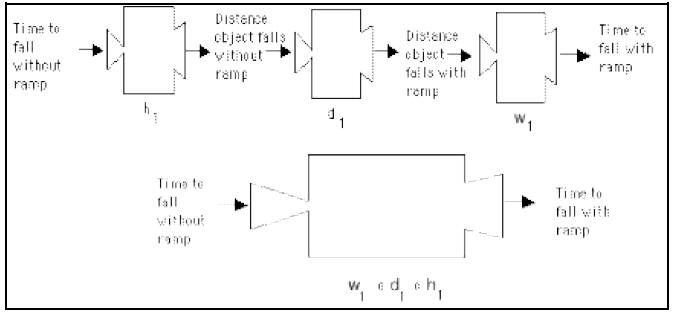
There are three steps required to get from the time that you know to the time
that you want to find. The first step is to use the time that you know to find
the
height of each of these cliffs. Then calculate the new height with the ramp.
Knowing the new falling height would allow you to calculate the time it would
take the car to fall that distance. This mapping from the time for the car to
fall
without a ramp to the time for the car to fall with a ramp is a composition of
three functions as shown in the following diagram:
The distance the car falls without a ramp is a function,
 of the time it falls
when no car ramp is in place.
The distance the car falls with a ramp is a function, of the distance the car
falls when no car ramp is in place.
The time it takes for the car to fall when there is a ramp is a function,
 of
of
the distance the car falls when there is a ramp.
The composition of these functions is a function,
 which describes the
time it takes for the car to fall when there is a ramp as a function of the time
it
takes for the car to fall when no ramp is in place.
The car will fall faster as it gets closer to the ground,
and the distance, measured
in meters, that it falls is related to the time by

This function rule makes it possible to calculate the
heights of each of the cliffs.
You could now use these numbers to calculate the drop with the ramp in place. If
h is the distance that the car falls without the ramp, then

is the distance that it will fall with the ramp. If you
input the values representing
the heights of each cliff,  gives the total
distance the car will fall with a 10-meter
ramp in place for each of the different cliffs.
You can now use the height of the drop with the ramp in place to calculate the
time it will take for the car to fall when the ramp is used:

The composition of these three functions in a particular
order is the function f, as
stated previously. Two different but equivalent notations can be used for f:

The following screen dump shows how the composite function
might be created
on one CAS.
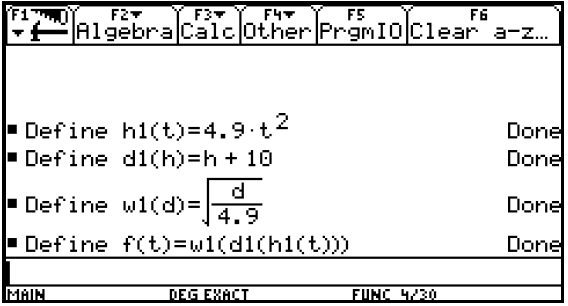
1. When you use your CAS to build the composite function,
what is displayed
for f(t)?
The power of composition of functions comes from the fact that it constructs a
function that goes directly from the initial input to the final output without
having to do all of the intermediate calculations. You now have a single
function
that goes directly from the time without the ramp to the time with the ramp.
2. Use the functions, and f to complete the
following table:
| Location |
Time
without
ramp
(seconds) |

Height
without
ramp
(meters) |

Height
with
ramp
(meters) |

Time with
ramp
(seconds) |
| canyon drive |
5.2 sec |
|
|
|
overlook
heights |
4.1 sec |
|
|
|
| alta vista |
4.8 sec |
|
|
|
| chasm canyon |
6.5 sec |
|
|
|
| rocky ravine |
3.3 sec |
|
|
|
mount
dropmore |
7.3 sec |
|
|
|
| riveredge bluff |
5.6 sec |
|
|
|
One of the features of composition of functions with a CAS
is that you can
change just one of the functions that go into the
composition and it will
automatically change the composite function.
3. A 15-meter ramp is also possible.
a. How, if at all, would this change your rules for functions,
 and
and
f?
b. What rule for functions
 and f do you get if
the ramp height is 5
meters?
c. What rules for functions
 and f do you get if the
ramp height is
20 meters?
d. Describe, in general, how your functions
 and f change as you
change the ramp height.
Exploration II: The Run Down on Alternative Composition
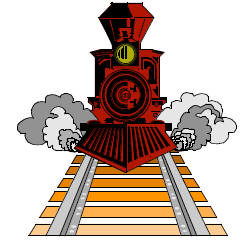
Situation: A Near Miss. The director
encounters another problem that
requires mathematical expertise. She wants to shoot a chase scene in
which
the hero’s speeding car crosses railroad tracks just ahead of a speeding
train. She wants this to be a near miss, but it is extremely important
that
the car and the train do not actually collide. The situation is shown in
the
following figure. |
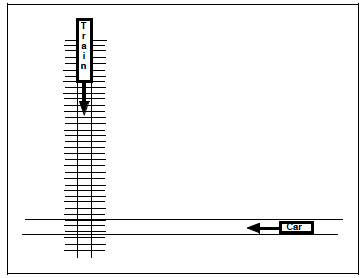
The director wants to begin to shoot the scene when the
car is 310 meters from
the intersection, moving at a constant speed of 108 km/hr, and the train is 220
meters from the intersection, traveling at a constant speed of 72 km/hr. Before
starting the shoot, however, it is critical that she know
how close they will come.
In particular, she needs to find the function that describes the straight line
distance between the front of the car and the front of the train. Once this
function
is known, a CAS can be used to find its minimum value.
1. Since the timing needs to be “split-second,” it makes more sense to analyze
the situation in terms of meters and seconds rather than kilometers and
hours.
a. How fast is the car moving in meters per second?
b. How fast is the train moving in meters per second?
2. Find the function that describes c(t), the distance from the front of the car
to
the intersection as a function of the time elapsed since the shoot began. You
want c(0) = 310, since, at the start, the car is 310 meters from the
intersection.
3. Find the function that describes e(t), the distance from the front of the
train
engine to the intersection as a function of the time elapsed since the shoot
began. You want e(0)=220 since the train initially is 220 meters from the
intersection.
4. Find a function rule for the straight line distance between the front of the
car
and the front of the train. Use as input values for your rule the distance from
the car to the intersection and the distance from the engine to the
intersection.
5. Graph d , and use your graph to answer the following
questions.
a. What is the minimum distance between the front of the car and the front
of the train?
b. At what time does this occur?
c. Find the distance from the front of the train to the intersection at this
time.
d. Find the distance from the front of the car to the intersection at this time.
e. One of these numbers will be negative. What does that mean?
6. Where is the back of the car at the moment when the front of the train and
the front of the car are closest? Why does this matter?
7. Assume that the car is 4.5 meters long. Find the function that describes the
straight line distance between the front of the train and the back of the car.
How close do they come?
8. Some people might expect that the front of the train
and the back of the car
are closest when the back of the car is in the intersection or when the front
of the train is in the intersection. How far apart are they at these two times?
Explain why these times do not give the shortest distance.
9. The director decides that she wants to increase the train’s speed to
90km/hr.
Where should the train start so that the back of the car is never less than 5
meters from the train?
Exploration III: In Step with Composition
Situation: Getting in Step with Composition of
Functions. Runners and
their track coaches often are concerned about the time it takes to run a
fixed
distance such as 100 meters. One of the variables that affects this time
is the
length of a runner’s stride, and stride length is often related to leg
length. |
In this exploration, you will work with video data to
generate functions
describing (1) time to cover a fixed distance at a fixed cadence as a function
of
stride or step length and (2) stride or step length as a function of leg length.
Given these two functions, you will be able to generate a composite function
which describes time to cover a fixed distance at a fixed cadence as a function
of
leg length.
Analyzing movement
To determine how fast someone is moving, it is helpful to use two variables:
step length, that is, how far apart the points are where first one heel then the
other heel touches the ground; and
cadence, or frequency of steps.
Step length is measured in  (read as “meters
per step”) and cadence is
measured in  You can use a process you may
have employed in the last
section to convert a measurement given in km/hr to m/sec. The process,
commonly used in science classes, lets you “multiply” unit labels. So the
resulting product ,  gives
gives . A quantity measured in
is a velocity.
In this exploration, the cadence, or number of steps per second, will be held
constant in order to study the impact of step length on how fast one can cover a
fixed distance. You will work with measurements taken from videos of people
walking on a sidewalk.
In order to interpret the data from the video, it is helpful to understand how
the
data were gathered.
A. Get information from a video.
Before continuing, you should either watch the video or simulate the
experiment. The video shows different people walking along the same stretch of
sidewalk, at approximately the same cadence.
Answer the following questions about the video:
1. The individuals who made the video clips used a metronome (a device to
help musicians keep a steady beat as they practice) to ensure that all the
walkers maintained the same cadence. Why do you think it might be
important to keep the cadence the same for all walkers?
2. The video camera was attached to a tripod and not moved during the
filming. This ensured that the video window captured each of the walkers
traveling the same distance. In this situation you will need to collect data
from a variety of people of different sizes, from very short to very tall. Why
do you think it might be important to use a variety of sizes?
3. At the beginning of each video clip, there is a person on the walker’s path
holding an object that displays the length of one meter. This provides a
known length or a scale that you can use to convert the measurements you
take from the video of the walker’s step length to their actual lengths.
Devise a way to convert the centimeters that are measured on the screen to
the meters involved in the size of the steps the person is taking if the meter
stick in the video measures 6 cm on the screen. Report your method here.
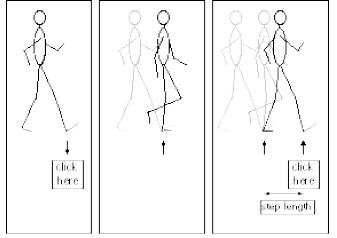
The distance between the points where the walker plants
her heels on
consecutive steps will determine her step length. Her foot should be in the
position of the stick figure (See the following figure.). Mark the vertex of the
angle formed by her foot and leg as her heel touches the ground.
Desired position for data collection.
The other piece of data you will need is the amount of
time it takes the person to
get from the start to the finish (that is, to pass through the window afforded
by
the video). There are a couple of ways you can measure time from the video
tape. Video players typically have an elapsed time feature that can be displayed
on the screen and set to zero where desired. Alternatively, you could use a
stopwatch. However, if a stopwatch is used, time the video clip several times to
try to establish a measurement consistent to the nearest tenth of a second.
B. Collect data (average step length and time) for one walker.
Watch one of the videos and look at a graph of the measurements taken for one
walker. (Either you will collect this data yourself, or your teacher will
provide it.)
The graph shows time on the horizontal axis and it shows position (or distance
traveled from the edge of the video screen) on the vertical axis.
1. How many steps were taken by your walker?
2. What is the total actual distance traveled by the person?
3. Compute the average step length for your walker.
4. What was the total time from the start of the first step to the finish of the
last
step?
C. Collect and compile data (average step length and time) for
each of the walkers.
1. Collect the data (step length and time) for each of the walkers for whom
measurements are available. Record your data here.
2. Using appropriate technology, make a scatterplot of the data where step
length is along the horizontal axis and time is on the vertical axis.
3. Generate and compare two function models for the data– linear and
exponential .
a. Record your models here.
b. Do the graphs of the models reveal any potential
problems for either
model? If so, describe the problem(s).
4. Which function is the better model? Defend your choice.
D. Collect and compile leg-length data for each of the walkers.
In studying the relationship between step length and time to travel a fixed
distance you needed to average the step lengths of individual walkers.
Sometimes when developing a model it is nice to have to take only one
measurement instead of taking many measurements that are then averaged.
One characteristic that seems to be influential in predicting a person ’s step
length
is the length of the person’s leg.
From the video, compile the leg length of each walker. Graph your data,
plotting average step length as a function of leg length.
1. Find a function rule that is a good model for the relationship between these
two variables (average step length and leg length). Defend your choice.
2. Why do you think this is a good model for the
relationship between the two
variables?
E. Generate a composite function for time as a function
of leg
length.
You now have two function models. In one function, leg length predicts step
length; and in the second function, step length predicts the amount of time
required to cover a fixed distance. Compose the two functions to produce one
function that gives amount of time required to walk a fixed distance given the
person’s leg length.
1. What kind of function is the composite function? Is it linear , quadratic,
exponential, rational, or other? Explain your choice.
2. Plot the class data for the points involving the leg
length and the time to
cover the fixed distance. Also, graph the function for the composed model
with the scatterplot. How well do you think it fits the data? Account for
discrepancies.


