Graphing Quadratic Functions
 |
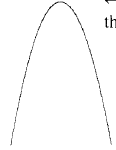
←The vertex is
the turning point. |
Or it can open down
with the vertex
being a maximum |
Finding the vertex is necessary to graph t he parabola and
for answering any
questions regarding maximums and minimums.
The two formats that we use for quadratic functions are
listed below.
General: y or
 where the vertex is (h,k )
or
Standard y or f (x) = ax2+ bx + c where the vertex can be found by the
formula
 and y is found by plugging the x into the function.
ln either format the" a" is the same value. lf a is
positive , the parabola opens u p
and if it is negative , the parabola opens down.
To Graph a Parabola :
1. Find and plot the vertex
2. Pick two x values smaller (or larger) than the x
-coordinate of the vertex.
Find the y - values and plot the points.
3. Draw your line of symmetry locate the image of the
points from step2
on the other side of the line of symmetry .
4. Draw the parabola .
On problems where you are asked to maximize or minimize a
value you will find
the vertex of the parabola . The maximum or minimum is the" y"- coordinate and
it occurs at the "x"-coordinate.