ABSTRACT
Due to skewed scaling of interconnect versus cell delay in
deep submicron CMOS, modern VLSI timing closure requires
extensive buffer insertion. Inserting a large number
of buffers may cause not only dramatic cell migration but
also routing hotspots. If buffering is not controlled well, it
may fail to close a design. Placement with buffer porosity
(i.e., cell density) awareness can allocate space for inserting
these buffers, and buffering with congestion awareness
can improve the routability. Therefore, there is essential
need for a placement framework with explicit porosity and
congestion control. In this paper, we propose the first integrated
nonlinear placement framework with porosity and
congestion aware buffer planning. We demonstrate the integration
of increasingly refined cell porosity and routing
congestion aware buffer planning and insertion methodology
in a high quality nonlinear placer. Our experiments
show the improvement of average routing overflow by 69%,
average wirelength by 28% and average buffer count by 40%,
compared with the traditional placement framework without
buffer planning.
1. INTRODUCTION
Interconnect optimization is critical in the modern physical
design closure flow since interconnect delay now dominates
gate delay, and its importance will keep increasing as
we further reduce feature sizes. Buffers insertion is a widely
used technique to tackle this increasing interconnect delay.
Optimal insertion of buffers in an interconnect reduces its
delay dependence on length from a quadratic function to a
linear function . For each technology node and a given routing
layer, there exists some optimal distance, called buffer
insertion length (BIL), such that placing buffers separated
by BIL along an interconnect minimizes the delay through
it. It is known that with each technology node global interconnects
do not scale (actually may even become longer),
intermediate interconnects can scale by 0.7X, but the buffer
insertion length (BIL) scales by 0.58X [15]. Therefore, the
number of buffers required on an (scaled) intermediate interconnect
increases by 1.2X whereas for global interconnects,
it increases by nearly 1.8X for each technology node.
It is predicted that the number of buffers may approach
70% at the 32nm technology node [17]. Without controlling
the cell porosity, there may be not enough space for
inserting buffers. Therefore, the placement by the traditional
placement algorithm may cause buffer number explosion
[16]. The number of buffers can explode as follows:
Insertion of a large number of buffers creates a lot of overlaps
with existing cells. Removing these overlaps during
legalization causes the placement to change drastically, introducing
new critical paths. To satisfy timing requirements
on these new critical paths, buffer insertion can be applied to
them, but the legalization of these new buffers may require
many existing cells or buffers be moved from their original
positions, invalidating the timing achieved by earlier buffer
insertion leading to even more additional buffers.
Another critical impact of buffer insertion of long interconnects
is the loss of flexibility available to a router which
can increase the routing congestion. Modern routers are
overwhelmed by requirements to satisfy electrical connectivity,
timing, wire density, crosstalk, and other objectives. As
a long net has much more flexibility to be routed as compared
to a sequence of short nets, buffer insertion, which
breaks an interconnect into several shorter interconnects,
reduces the flexibility available to the router. Also, since
typical interconnect structures are trees (with only one path
from source to each sink), the connectivity constraint for a
router is a hard requirement without which the chip will not
function.
To overcome the possible buffer number explosion and
routing bottlenecks, there is critical need for a framework
for integration of buffer insertion considering routing congestion
during placement. Such a framework should start planning
the buffers at early stage and follow through its planning
until the final stage of placement. This work presents
the first framework of this kind — we integrate increasingly
refined routing congestion aware buffer estimation and
planning technique in a high quality nonlinear placer. Our
framework shows promising results, and is able to reduce the
average buffer numbers by 40%, average routing overflows
by 69% and average wirelength by 28% compared with the
traditional placement without buffer planning.
The rest of this paper is organized as follows: Section 2
discusses the previous work and our main technical contributions.
We present a brief background on placement, routing
congestion and buffer insertion in Section 3. Section 4
presents our problem formulation and the proposed framework.
We demonstrate the efficacy of our approach with
results in Section 5. Section 6 concludes our paper.
2. PREVIOUSWORKS AND OUR
CONTRIBUTIONS
There are some previous works handling buffer insertion
during the placement. However, none of them consider the
routing congestion. As will be shown shortly, this is a major
drawback because the impact of buffer insertion on routability
can be huge, especially at lower technology nodes where
the buffer number is predicted to be very high.
Saxena and Halpin proposed an integrated buffer insertion
and placement flow by modeling buffers explicitly based on
a Kraftwerk-like quadratic placement flow [16]. Goplen et
al. further extended their flow using net weighting to reduce
the buffer counts [9]. Luo et al. proposed an integrated
buffer insertion and placement flow by modeling buffers as
dummy blocks that does not involve in quadratic placement
and re-inserting buffers into new positions for each
placement iteration [13]. Jahanian and Zamani proposed
a buffer planning algorithm for the floor-placement design
flow by creating a buffer requirement map and moving the
whitespace by the detailed placement based on the map [10].
Unlike those previous works, we present a new integrated
nonlinear placement framework with porosity and congestion
aware buffer planning. Given a circuit, our placer finds
the desired positions for all cells and reserves whitespace for
buffers in their most probable insertion location during the
placement process. In addition, our framework analyzes the
buffer count and their locations at various levels of granularity
and minimizes the wirelength and the routing congestion
at the same time. Our main technical contributions are:
• We propose the first simultaneous buffer planning and
placement framework which is aware of routing congestion,
integrated in a nonlinear placement framework.
• We propose and apply several increasingly finer granularity
buffer density estimation techniques to guide the
global placement to intelligently reserve whitespace for
buffer insertion. This approach smoothly spreads the
cells and buffers and converges to a desired placement.
• The Steiner tree topology is considered during the placement
and the buffer insertion algorithm. Use of Steiner
tree gives us a quick peek at the possible routing scenario
and adjust the placement accordingly, leading to
better routability.
3. PRELIMINARIES
In this section, we review the nonlinear analytical placement
method, buffer insertion, and routing congestion.
3.1 Nonlinear Placement
We use a hypergraph H = (V,E) to model a circuit. Let
vertices V = {v1, v2, ..., vn} represent cells, and hyperedges
E = {e1, e2, ..., em} represent nets. Let xi and yi be the x
and y coordinates of the center of cell vi, respectively.
The analytical placement approach optimizes wirelength
under the density constraint. The uniform non-overlapping
bin grid model for the placement region is used to model the
density constraint. Therefore, the global placement problem
can be formulated as a constrained minimization problem as
follows:

where W(V,E) is the wirelength function, Dcell(V ) is the
cell area function in bins, and Dgrid is the total area allowed
in a bin. The wirelength W(V,E) is defined as the
total half-perimeter wirelength (HPWL). Since W(V,E) is
not smooth, it is hard to minimize it directly. We apply the
log -sum-exp function [11,14], which is one of the most effective
and efficient function for HPWL approximation. The
cell area in a bin can be computed by the horizontal overlap
multiplies the vertical overlap. We use the bell-shaped
function [11, 14] to smooth the overlap function.
To solve Eqn . (1), we use the quadratic penalty method,
implying that we solve a sequence of unconstrained minimization
problems of the form

with increasing λ’s. The solution of the previous problem is
used as the initial solution for the next one.
3.2 Buffer Insertion
Buffer insertion is usually applied in an iterative
fashion.
Given a placement, we compute the failing paths in a design,
insert buffers to desired positions to fix timing, and
remove overlaps caused by buffers. The resulting placement
is then analyzed again for timing, and additional buffers
may need to be inserted. The insertion step iteratively continues
until the timing is satisfied. However, as the buffer
count increases rapidly with process scaling, this approach
does not work since the newly introduced buffers create too
many placement overlaps and the placement cannot be legalized
without significant placement perturbation. Such a
large placement perturbation generates new timing critical
paths which need to be buffered again, leading to a possibly
never ending loop.
On a hypernet, buffer insertion can be done for different
objectives such as maximizing the worst (among all sinks
of the hypernet) negative slack, minimizing the delay of the
most critical sink, minimizing the delay of all the sinks, or
bounding the maximum slew rate of the signal. Since the
primary focus of this work is not the comparative study of
pros/cons of different buffering objectives, in this work we
applied buffer insertion for minimizing the delay of all the
sinks of a failing hypernet as well as for hypernets for which
slew is more degraded than allowed by the library.
3.3 Routing Congestion and Buffers
With a large number of buffers on a chip, placement of
these buffers may determine the ease of routing of each net.
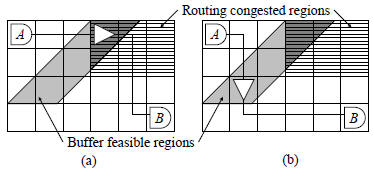
Figure 1: (a) The buffer position causes higher routing
congestion. (b) Another buffer position does not
increase routing congestion.
Buffer insertion restricts the flexibility of different
routes for
a net. Buffer insertion divides the net into several smaller
net segments, and router usually route them independently.
Therefore, a bad buffer insertion position may cause routing
go through high routing congestion areas. We give an
example in Figure 1. The regions with horizontal lines have
higher routing congestion. The gray parallelogram is the
region in which a placement of buffer satisfies the delay constraint
between cells A and B. If the buffer is placed inside
the routing congested region, Figure 1(a), the router cannot
avoid going through this region since the net terminal is located
in it. In contrast, if we place the buffer outside the
congested region, Figure 1(b), we can avoid the net from going
through the congested region thus relieving the routing
congestion.
4. PROPOSED FRAMEWORK
4.1 Formulation
To deal with increasing buffer count, the placement
formulation
needs to consider the cell/buffer porosity and routing
congestion during the placement. We have the new formulation
for the placement with buffer density as follows,

where W(V,E) is total half-perimeter wirelength of all
nets,
Dcell is the area of cells, Dbuf is the area of buffers,
and
Dgrid is the area of the bin grids.
The buffer density Dbuf is computed based on the current
placement. All timing failing nets that are longer than the
buffer insertion length (BIL) need to be buffered. A static
timing and slew analyzer can be used to find the nets that
need to be buffered, and the BIL is computed according to
the given technology parameters. The buffer density map
provides the possible buffer insertion positions and guides
global placement to reserve enough whitespace for buffer insertion.
Considering a source-sink net in Figure 2(a), we can
compute optimal buffer insertion positions using the BIL.
We can apply the two-dimensional Feasible Region from [8].
The feasible region is defined as the region where the buffer
may be located such the delay constraint can be satisfied
by inserting the buffer into any location in that region. It
is shown that even under very tight timing constraint, say,
10% more delay from the optimal delay, the feasible region
can be as much as 50% of the wire length. An example of
the two-dimensional feasible region is shown in Figure 2(a),
which provides a lot of flexibility to plan buffer locations
while minimizing routing congestion. The buffer density
map is obtained by summing up all possible buffer regions,
as shown in Figure 2(b).
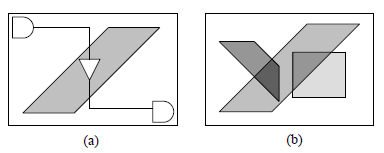
Figure 2: (a) Using the feasible region to the compute
the buffer density. (b) The buffer density map
is derived from the summation of all predicted buffer
density regions.
We resort to the quadratic penalty method to solve Eqn.
(3):

To efficiently solve solve the unconstrained problem in
Eqn. (2),
we apply the conjugate gradient (CG) method with controlling
the step size dynamically [6]. During each iteration,
we update the buffer density Dbuf based on current placement
and the given buffering model. Inserting buffers does
not effect HPWL because we always allocate buffers inside
the bounding box of the net. With gradually increasing λ
and the cells are spread with necessary buffer space allocated.
As a result, we can find a desired placement with
the optimal wirelength that does not violate density constraints.
Further, since the buffer density is constructed using
a congestion-aware method, the resulting routing overflows
can be reduced effectively.
4.2 Buffering Model
To pro-actively estimate buffer insertion positions, the
ideal way is to call the router and get the net topology and
the routing congestion. However, such a flow would be exceedingly
slow. The buffering step is performed many times
during the placement, and thus only faster models can be
applied. We introduce the following four buffering models.
See Figure 3(b), (c), (d), and (e) for the illustrations of the
corresponding models.
• HPWL. The half-perimeter wirelength (HPWL)
divided
by the buffer insertion length (BIL) is used to
obtain the required buffer number. The buffer density
inside the wire bounding box in this stage is

where wbb,i (hbb,i) is the width
(height) of the bounding
box of net i, lcric is the BIL, and ti is the number
of the terminals for net i.
• StWL. Steiner wirelength is used to computed the
buffer number. The buffer density inside the wire
bounding box is

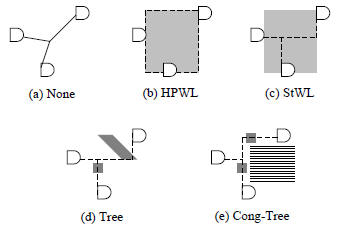
Figure 3: Five different levels of buffer density
computation.
The shading regions are buffer density region.
(a) Pure wirelength-driven placement without
buffering. (b) Using HPWL. (c) Using Steiner wirelength.
(d) Using Steiner tree. (e) Using Steiner
tree with congestion consideration.
where si is the Steiner wirelength of net i.
The migration
from HPWL to Steiner wirelength improves the
accuracy of the number of buffers. Since buffer prediction
is performed during placement many times, we
need a fast yet accurate Steiner wirelength calculation
method, such as FLUTE [7]. Note that our implementation
is not limited any particular Steiner tree
generation tool because at this stage we only use the
Steiner wirelength.
• Tree. Based on the Steiner tree topology, the
buffering
map is computed using the feasible regions of buffers
while traversing the Steiner tree based on the buffer insertion
length. This gives the most accurate estimate
of number of buffers and their possible positions.
• Cong-Tree. Based on the Steiner tree topology, we
us the probabilistic routing model [12, 18] to estimate
the routing congestion. Then, we consider the possible
routing paths through the feasible regions and pick a
path which contribute the least congestion .
Although the tree models are more accurate than wire
length models, the placement process may become very slow
because of Steiner tree construction. Therefore, instead
of directly using the Steiner tree for buffering and congestion
consideration, we propose to use the MIX model, a sequence
of five stages with increasingly accurate estimation
and smoothly spreading the cell during the placement.
At first stage, a pure wirelength-driven placer without
buffer planning is used to obtain a rough placement. Since
cell positions changes very fast during this stage, the buffer
requirements and congestion are hard to estimate accurately.
As the placement iteration increases, we gradually change to
more accurate models, HPWL, StWL, Tree, and Cong-Tree,
for each stage to compute buffer density, see Figure 4. Between
each stage, we analyze the timing according to latest
cell coordinates. During the final stage of our placement
flow we actively place the buffer in low congested region.
4.3 Our Flow
Figure 5 gives our placement flow. First, we find a rough
placement by solving the wirelength-driven placement problem
in the clustered level. We cluster cells using the bestchoice
clustering algorithm [5]. Then, all cluster positions
are obtained by minimizing the function 

Dcell)2. After declustering, we obtain a rough placement.
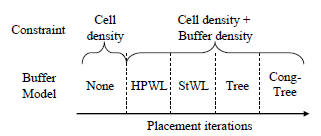
Figure 4: The MIX model. Buffering model changes
as the placement iteration increases. This approach
can smooth the buffer density function and spend
much shorter runtime compared with using Cong-
Tree alone.
01. // Obtain a rough placement.
02. Cluster cells to obtain the clustered netlist;
03. Minimize 
04. Decluster cells to get a rough placement;
05. ite = 0;
06. // Continue placement with buffer planning.
07. do
08. ite = ite + 1;
09. Select a model according to ite;
10. Analyze the current timing;
11. //Minimize 
12. do
13. if( buffering model == CongTree )
14. Update the congestion map;
15. Update cell density and buffer density;
16. Compute the conjugate gradient direction;
17. Update current cell positions;
18. until (the minimal value is found);
19. Increase λ by 2;
20. until (there is no area overflow in bins or
21. the placement is converged);
22. Insert buffers into desired positions;
23. Legalize the placement;
24. return netlist and cell/buffer positions;
Figure 5: Our placement flow.
Then, we enter the loop to further optimize wirelength
with buffer planning. In each iteration, we select a buffering
model and analyze timing to get the latest timing information
to determine which nets to be buffered. Then, we find
the desired placement by minimizing the objective function
 . The conjugate gradient
method with dynamic step size method is applied, and the
buffer density map Dbuf is updated inside the conjugate
gradient loop. If the buffering model Cong-Tree is used, we
also need to update the routing congestion map during the
placement. The placement iteration continues until all required
buffer space are allocated, and there is no or little
density overflows in each bin. Then, we insert buffers into
the pre-allocated buffer space, and the placement is legalized
and all overlaps are removed. Finally, we return the
modified netlist and all cell/buffer positions.
5. EXPERIMENTAL RESULTS
We implemented the proposed nonlinear placement framework
in C++, and all the experiments were conducted on
a 3.40GHz Intel Pentium 4 machine. OpenAccess [2] and
OAGear timer [3] are used for our experiments. By default
the OAGear timer uses a linear delay model (i.e., it assumes
optimal buffer insertion has been done on each net),
but since our aim is to quantify the impact of buffer planning/
insertion, we modified the OAGear timer to compute
the Elmore delay.
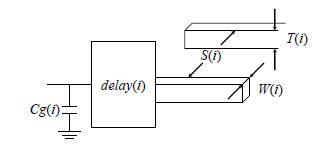
Figure 6: Parameters of the cell library. X(i) is the
value of parameter X for technology node i. Cg, S,
T and W represents gate input capacitance, interwire
spacing, interconnect height and interconnect
width. Delay represents the delay through a cell.
We tested our proposed placement framework on five Open-
Cores circuits [1,4]. The benchmark statistics are shown in
Table 1. We set the chip utilization rate to 60%. By doing
so, we can focus on the effects of different buffer planning
methods and minimize the possibility of failing to remove
overlaps by the legalizer. Because our nonlinear placement
framework does not evenly distribute cells to the whole chip,
using low utilization rate does not harm the resulting wirelength
at all.
In order to model wiring and placement complexity at
32nm process technology nodes, we used unshrunk cells along
with shrunk inter-repeater distances. The work in [16] experimentally
observed that this method of analysis successfully
lower-bounds future technology node’s buffer insertion
problem. Figure 6 represents the state of a library gate and
interconnect parameter at a particular technology node i.
We used the following equations to advance the technology
node from Cadence CRETE 180nm library down to 130nm,
90nm, 65nm, 45nm, and 32nm.

Using these geometrical parameters, we calculated the
scaling
factor for other parameters such as sheet resistance,
sheet capacitance, edge capacitance and via resistances and
re-built the Liberty format which was read in by the placer
and the OAGear timer.
Two experiments were conducted. First, we compared
different buffering models. Second, three different placement
approaches were evaluated. The same iterative buffer
insertion method was applied to all placement results: we
computed the failing paths in a design, inserted buffers to
desired positions to fix timing, and removed overlaps caused
by buffers. These three step were iteratively performed until
the timing was met or the iteration had been executed for
10 times, and the final results are reported.
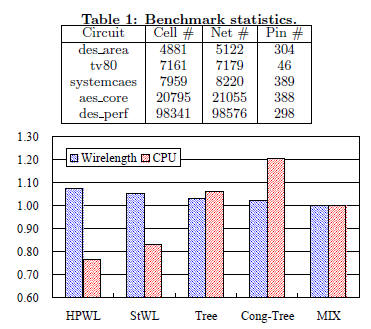
Figure 7: The normalized wirelengths and CPUs for
different buffering models.
5.1 Buffering Model Comparison
In the first experiment, we compare the four buffering
models, HPWL, StWL, Tree, and Cong-Tree, with our progressive
mixed model (MIX), which was introduced in Section
4.2. We use our placement framework integrated with
these five different models individually to obtain the placement
CPU times and the final wirelengths after buffer insertion.
The average wirelength and the CPU time are plotted
in Figure 7. All results are normalized to those using our
MIX model. It is clear that a more accurate model can lead
to shorter resulting wirelength but with longer placement
CPU time. Our MIX model results in the shortest average
wirelength, which is 8%, 5%, 3%, and 2% lesser than those
by HPWL, StWL, Tree, and Cong-Tree models, respectively.
This reveals the importance of smoothing the buffer density
function gradually instead of using the most accurate model
(Cong-Tree) in the nonlinear placement framework. The
average CPU time of the MIX model is right at the middle.
These results show that our MIX model can effectively
reduce the wirelength while spending moderate CPU time.
5.2 Results of DifferentPlacementApproaches
In the second experiment, we compare three different
placement
approaches: (1) placement without buffer planning,
(2) integrated placement with porosity aware buffer planning,
and (3) integrated placement with porosity and congestion
aware buffer planning. Table 2 gives the resulting
buffer counts, wirelengths, routing overflows, and CPU
times. The buffer count is the total number of buffers after
iterative buffer insertion; the wirelength is the final HPWL
of the modified netlist; the overflow value is reported using
the probabilistic routing model [12, 18], which has high
correlation with various routers and is also used in many
routers; the CPU time is only for the placement part, excluding
the time for iterative buffer insertion. The last row
in Table 2 reports the average values that are normalized to
those without buffer planning.

Compared with the placement without buffer planning,
the integrated flow with porosity aware buffer planning reduces
the average buffer count by 24%, the average wirelength
by 17%, the average routing overflow by 34%. The
CPU time is around 2.39X. Compared with the integrated
flow with only porosity awareness, the integrated flow with
porosity and congestion awareness can further reduces the
average buffer count by 16%, the average wirelength by 11%,
the average routing overflow by 35%. The CPU time penalty
is due to the routing congestion analysis and the congestion
aware buffering model during the placement. Although the
placement CPU time itself is 3.15X, the resulting placement
has much less routing overflows that may significantly reduce
the routing time. The results show that our proposed
integrated framework with porosity and congestion aware
buffer planning can effectively obtain high quality placement
results.
6. CONCLUSIONS
In this work, we presented the first integrated nonlinear
placement framework with porosity and congestion aware
buffer planning. Our framework performs buffer planning
starting from very early global placement stages, followed
by increasingly accurate buffering models and congestion
estimation. We validated our framework for several Open-
Cores benchmarks at the projected 32nm technology node
and demonstrated significant improvement in design closure
process using metric such as number of buffers, wirelength,
and routing overflows.
Our future work will be targeted in two directions. We
would like to explore buffer insertion for other objectives
(rather than for minimizing the delay to each sink of a hypernet).
We would also like to exploit the methodology of
using the sequence of increasingly accurate whitespace requirement
for other related issues such as simultaneous gate
sizing and placement.


