From your syllabus:
"Chapter Tests are worth 10 points each and will be
administered at the beginning of class on scheduled dates.
There are no makeup
Tests available. Tests will consist of a
maximum of five problems similar to those in the Chapter
Test in the book."
You have ten minutes to
complete the test.
Have fun & Good Luck!
Schedule for today
· Stamp, Grade Homework
· Chapter 2 Test
· Graphs: reading, scaling, points
· Graphing linear equations
Vocabulary
Bar Graphs: used to show differing amounts
(comparisons)
Circle Graphs (or Pie Chart ): used to show the
relationship of
different parts of a whole (percents)
Line Graphs : used to show how amounts change
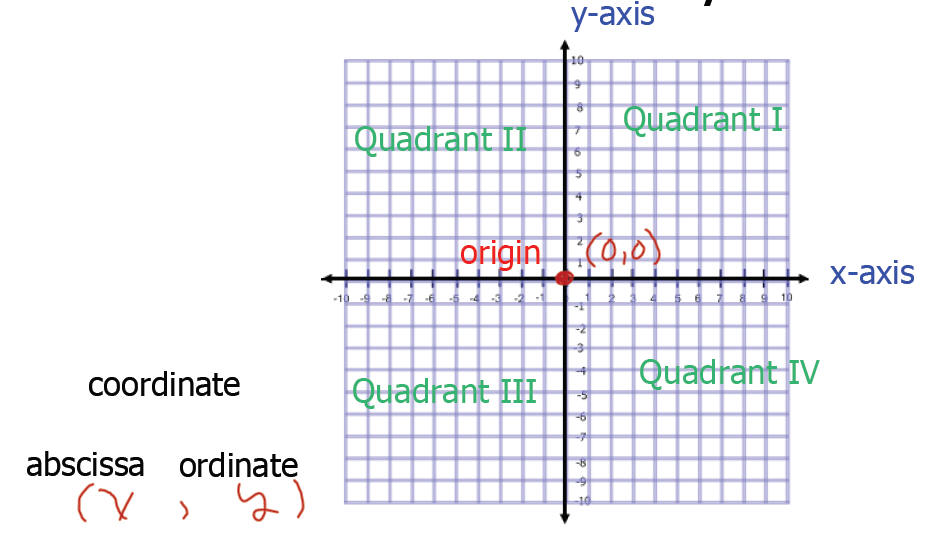
Cartesian Coordinate System : a standard method of
location points
on a plane that is cut by a horizontal axis and vertical axis. (Also
known as the Rectangular Coordinate System)
Coordinate: a number that is associated with a
point on a plane
Linear Equation : a firstdegree
polynomial equation in one or more
variables
Bar, Circle and Line Graphs
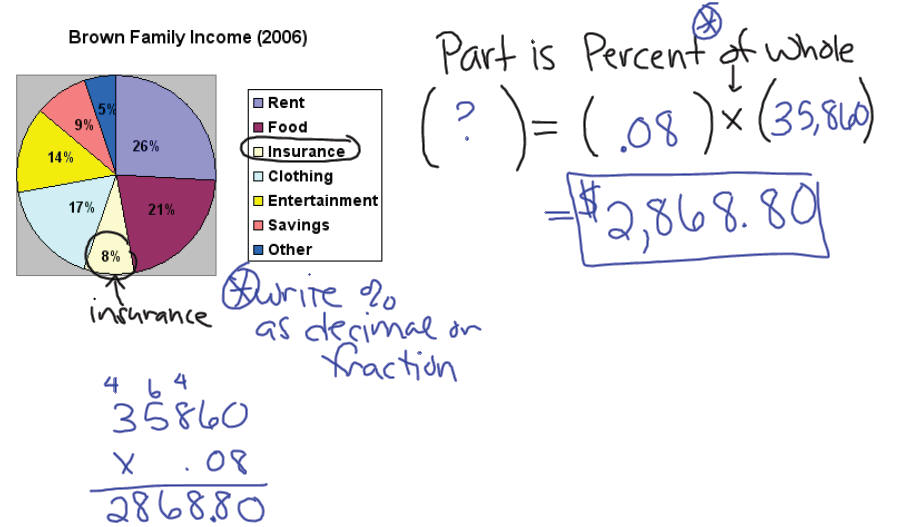
Example 1: Examine the circle graph below. If the
Brown
family had an income of $35,860 in 2006, how much did they
spend on insurance?
Bar, Circle and Line Graphs
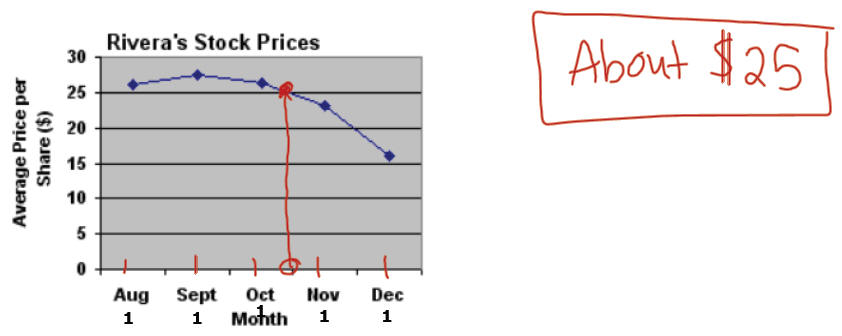
Example 2: Given the line graph below, what is the
approximate
price of a share of Ms. Rivera's stock on October 15th?
Bar, Circle and Line Graphs
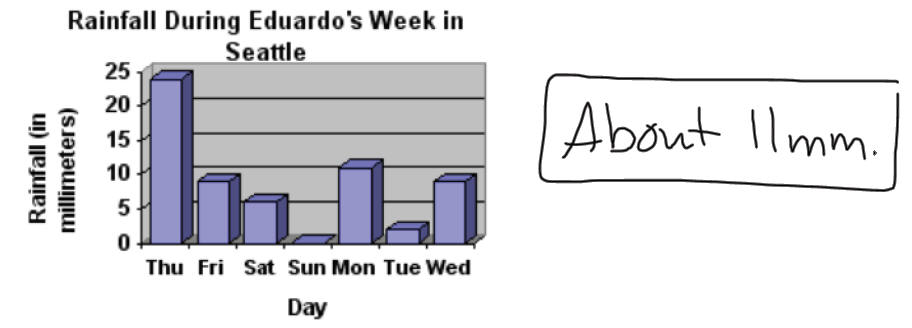
Example 3: Review the bar graph below. About how
much rain
fell in Seattle on Monday?
Plotting Points The-Cartesian Coordinate System
Recall: Graphing a the solution of an equation or
inequality:

Suppose we wanted to find the solution to the following
problem:
Name two numbers whose sum is 5.
Plotting Points The-Cartesian Coordinate System
The Cartesian Coordinate System
Plotting Points The-Cartesian Coordinate System
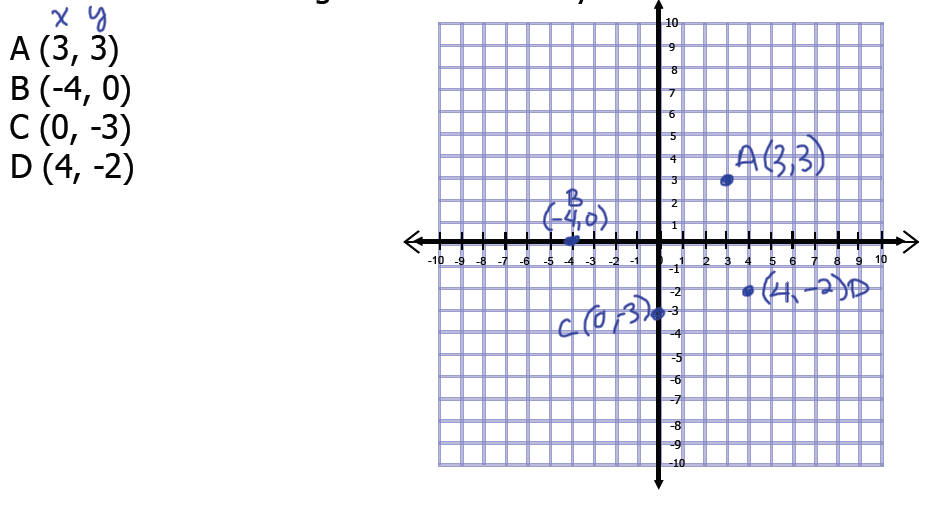
Example: Graph the following ordered pairs of (x,y)
coordinates on the rectangular coordinate system below .
Plotting Points The-Cartesian Coordinate System
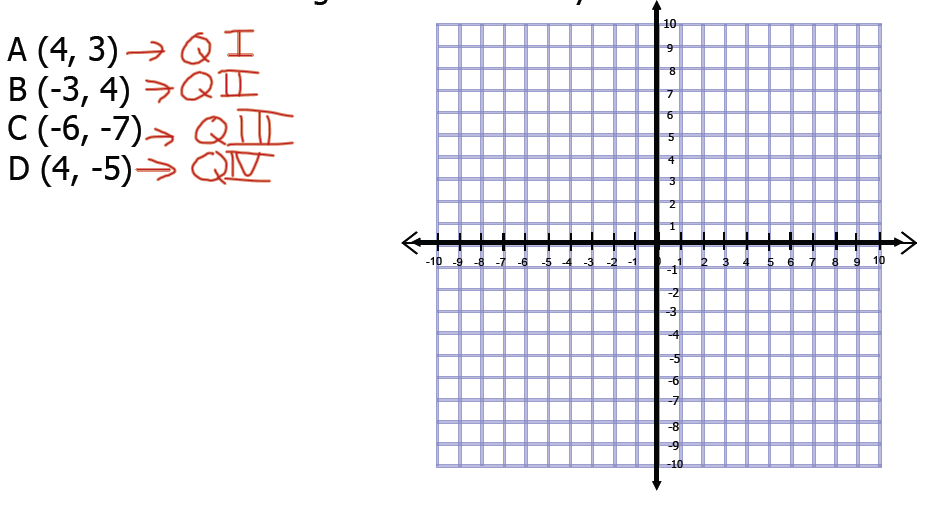
Practice 1: Graph the following ordered pairs of (x,y)
coordinates on the rectangular coordinate system below.
Plotting Points The-Cartesian Coordinate System
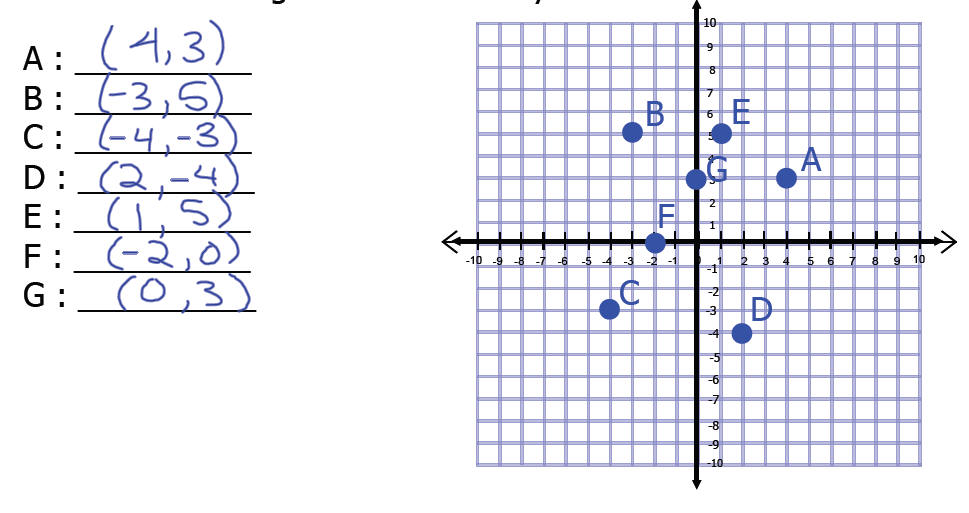
Practice 2: Find the coordinates of the points A,
B, C, D, E, F,
and G on the rectangular coordinate system below.
Schedule for today
· Stamp, Grade Homework
· Chapter 2 Test
· Graphs: reading, scaling, points
· Graphing linear equations
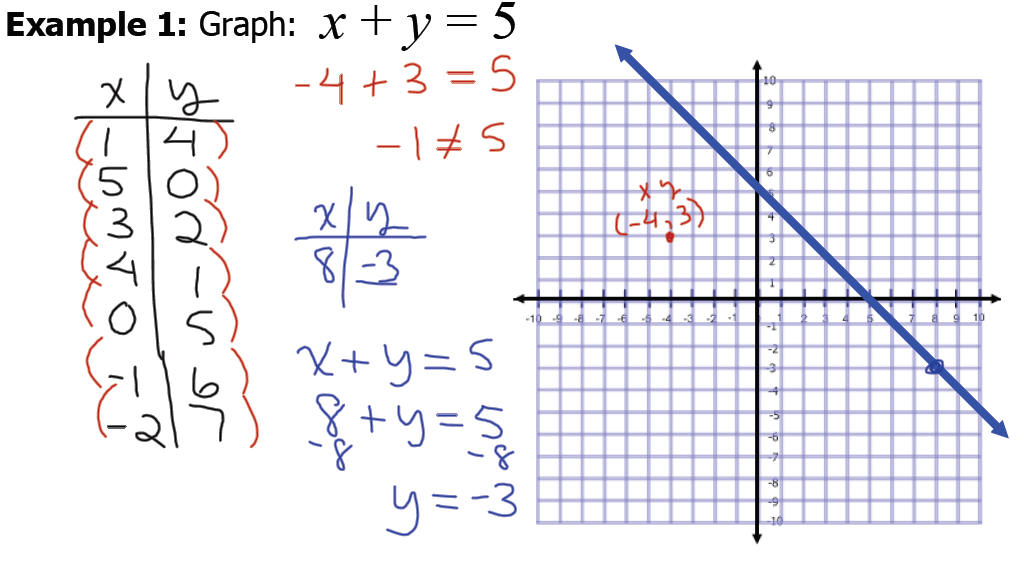
Graphing Linear Equations
Recall the following problem:
Name two numbers whose sum is 5.
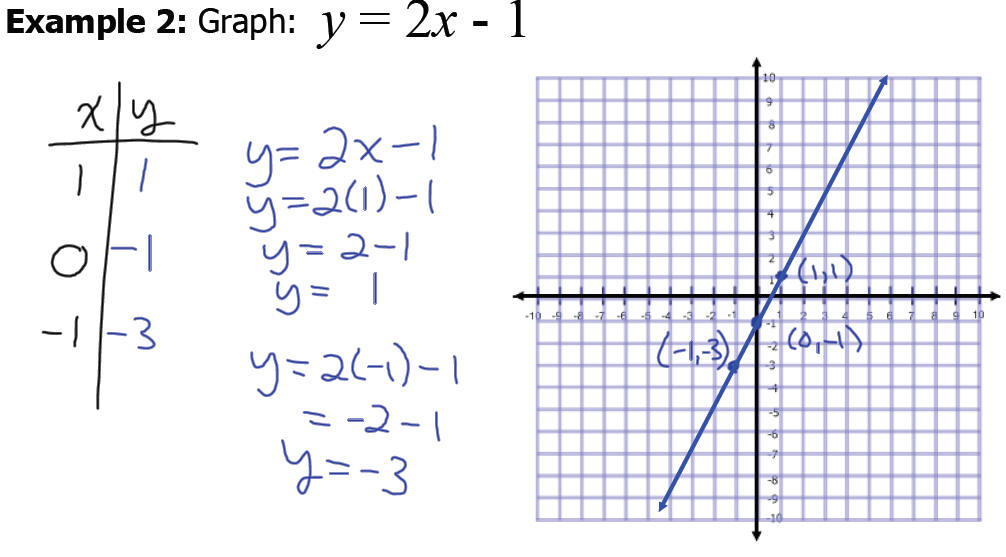
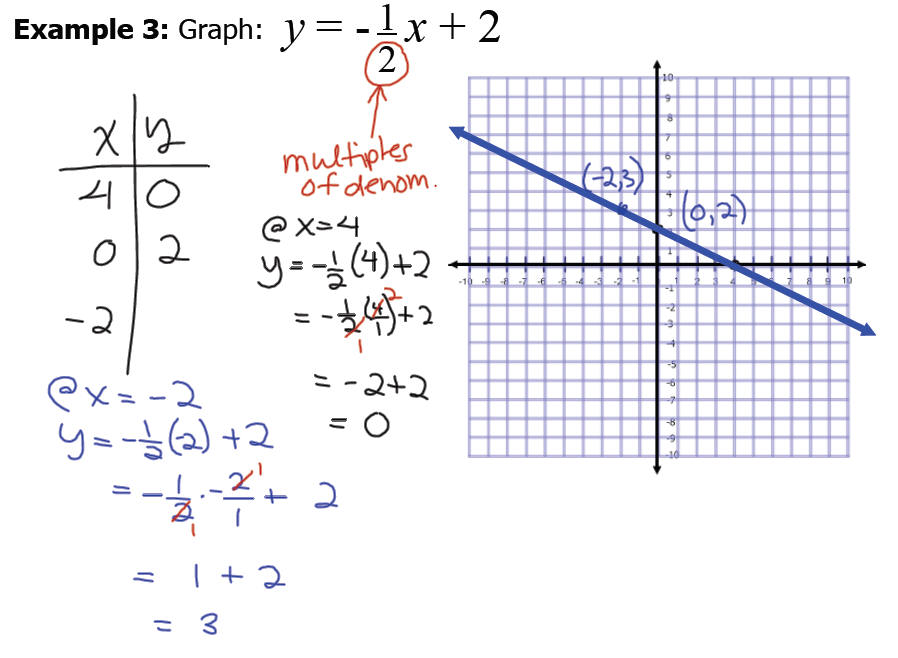
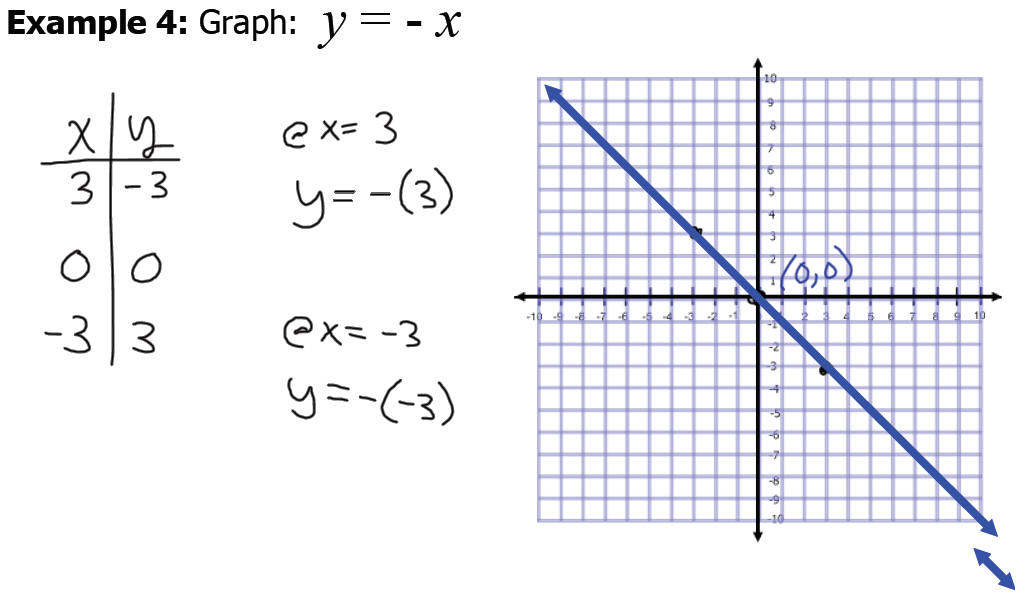
Graphing Linear Equations
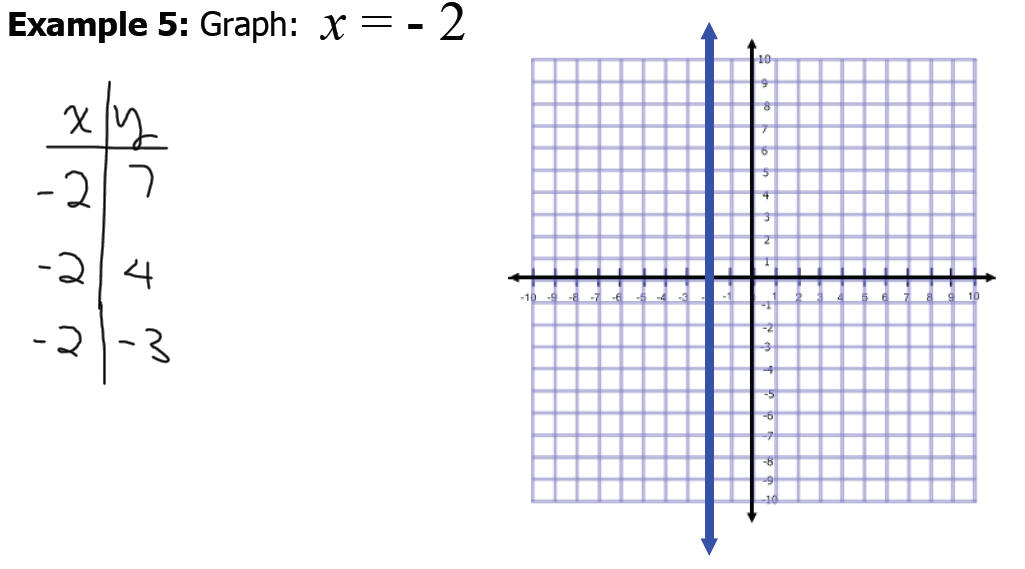
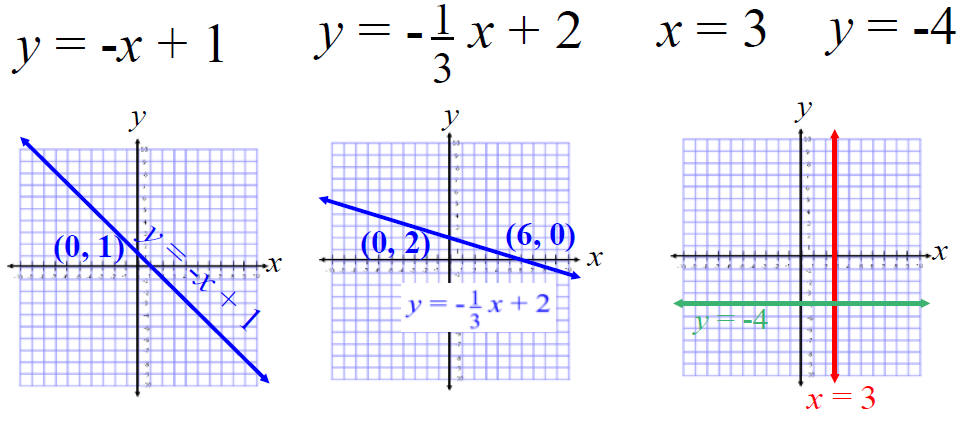
Graphs of Vertical and Horizontal Lines
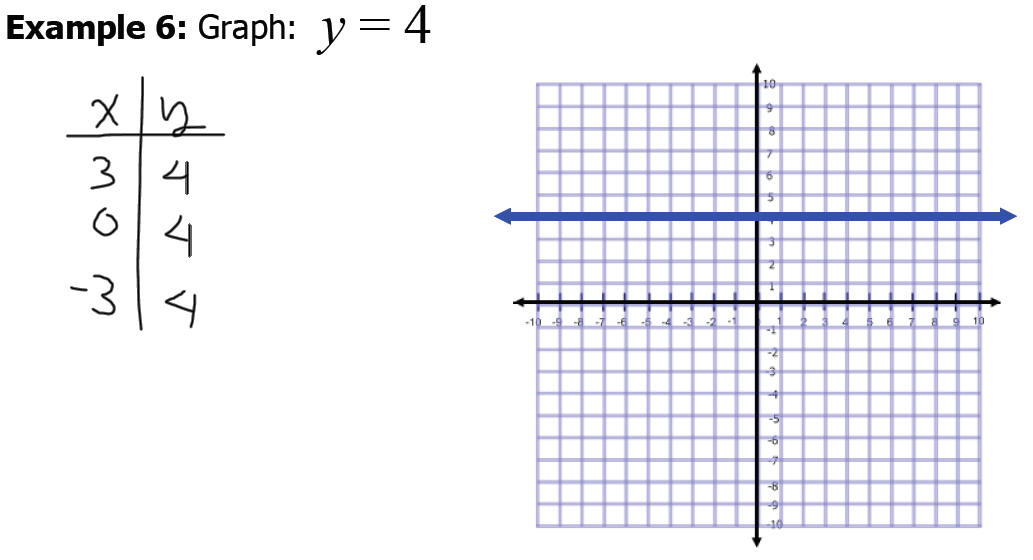
Practice:
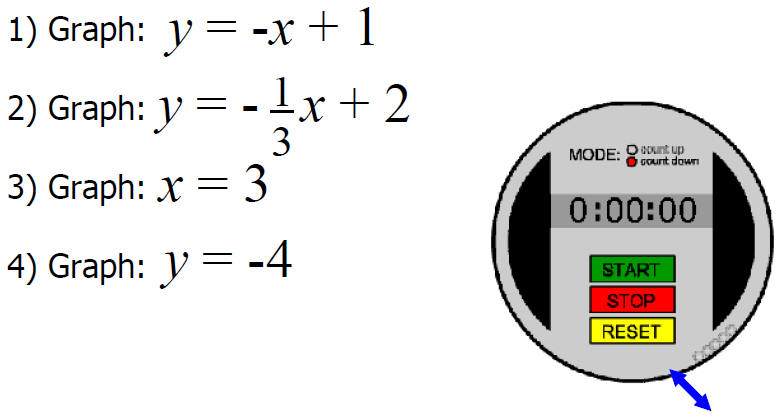
Practice:
Recall
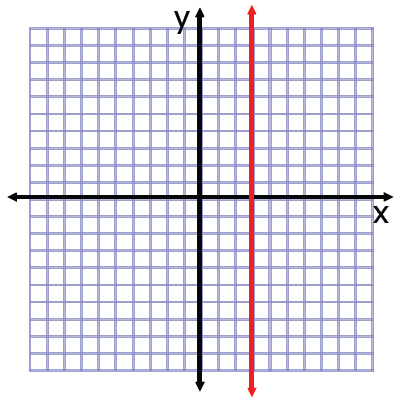
Recall: A vertical line is represented by the
equation x = k,
where k is the value of the x -coordinate
of any point on the line.
Recall: A horizontal line is represented by the
equation y = k,
where k is the value of the y-coordinate
of any point on the line.
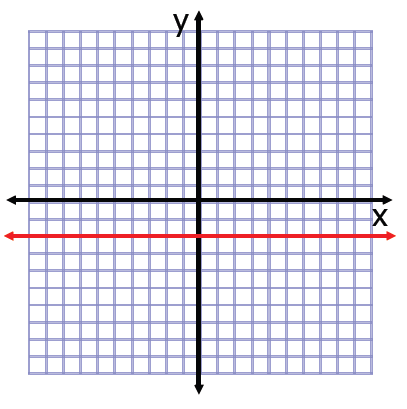
Check for understanding: Write the equation of each
line.
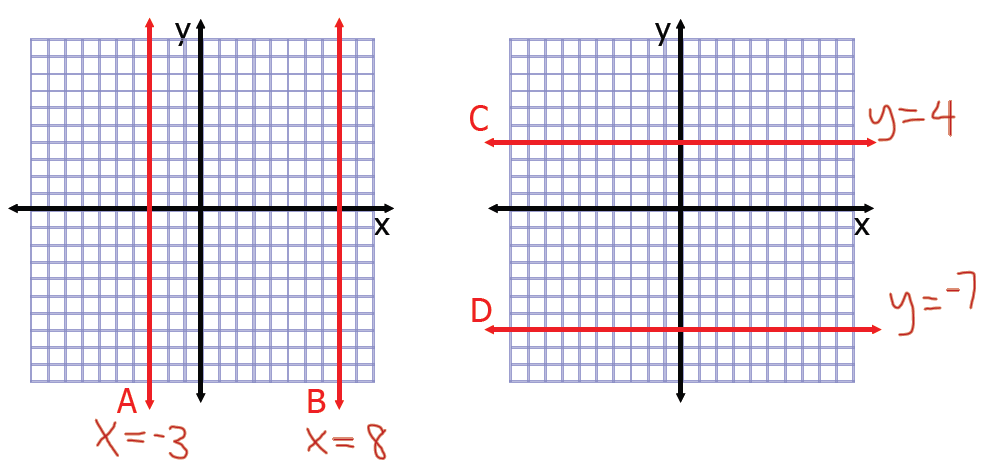
Vocabulary
Slope- intercept form of a line: the equation of any
line that is
not vertical can be written in this form. y = mx + b

y-intercept: the point where the graph
crosses the y-axis.
It is the y-value when x = 0. (In the slope-intercept
form of a line, b is the y-intercept.)
x-intercept: the point where the graph
crosses the x-axis.
It is the x-value
when y = 0
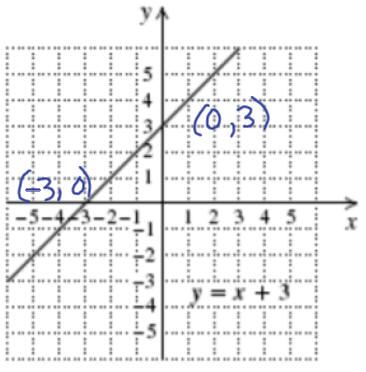
Graphing Lines
Example 1: Graph using intercepts. y = -3x + 6
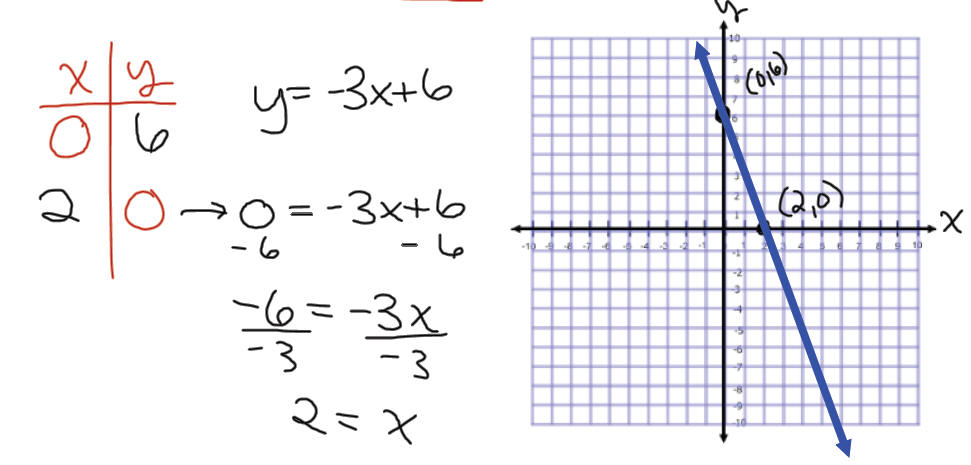
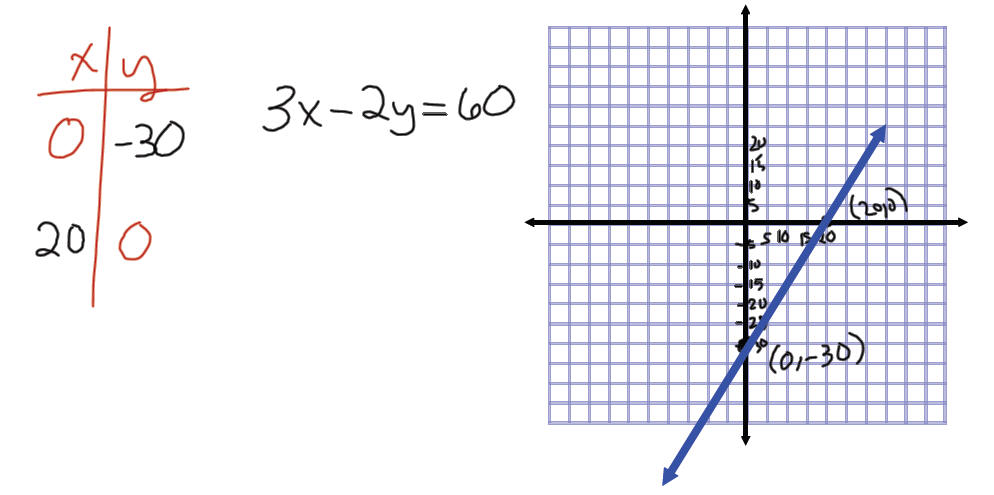
Example 2: Graph using intercepts. 3x - 2y = 60
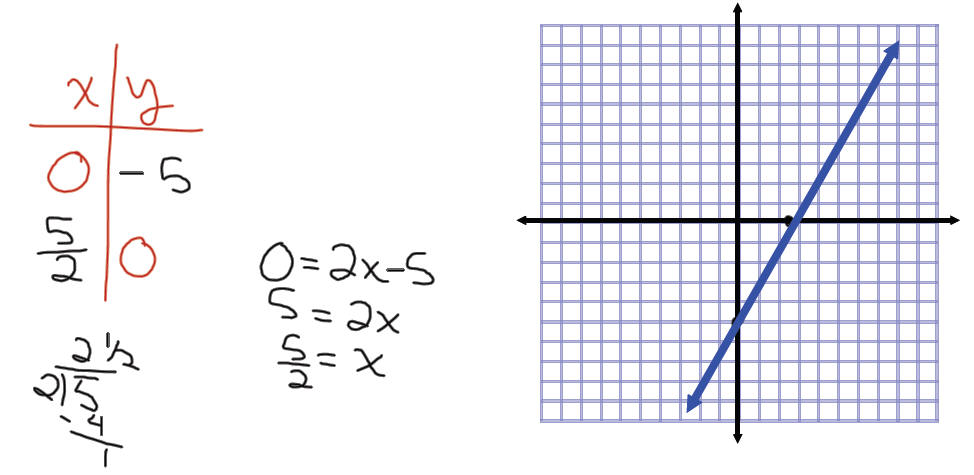
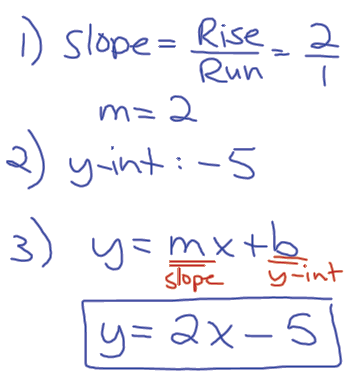
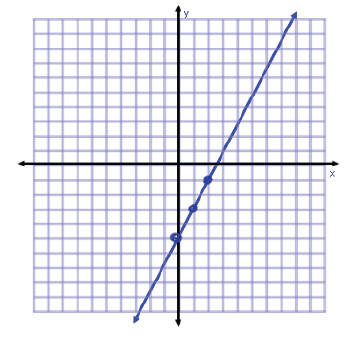
Practice: Graph using intercepts. y = 2x - 5
Slope
Recall: The slope-intercept
form of a line: y = mx + b
The m is the slope of the line
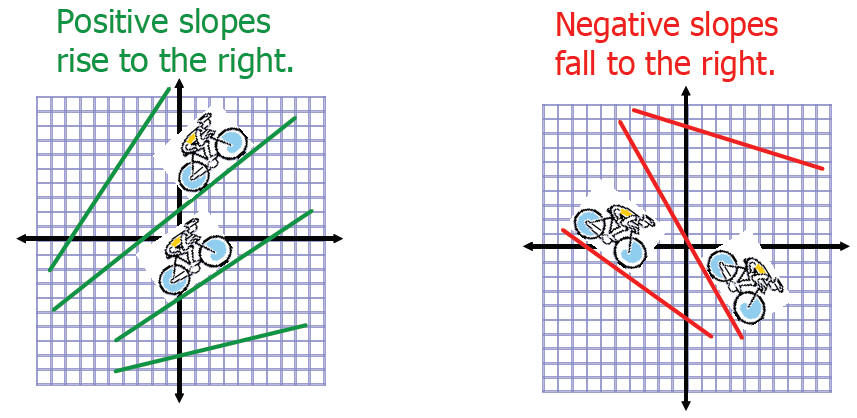
Slope: The ratio of the rise to the run of a line.
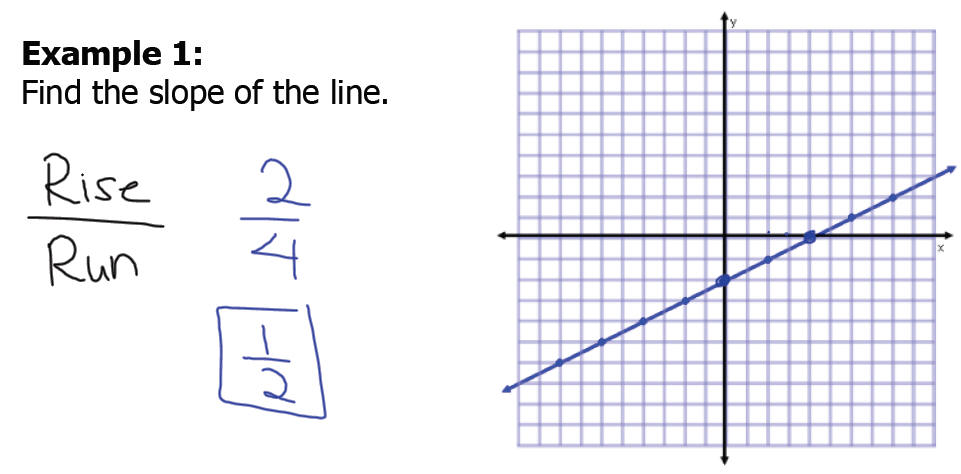
Example 2: Find the slope of the line.
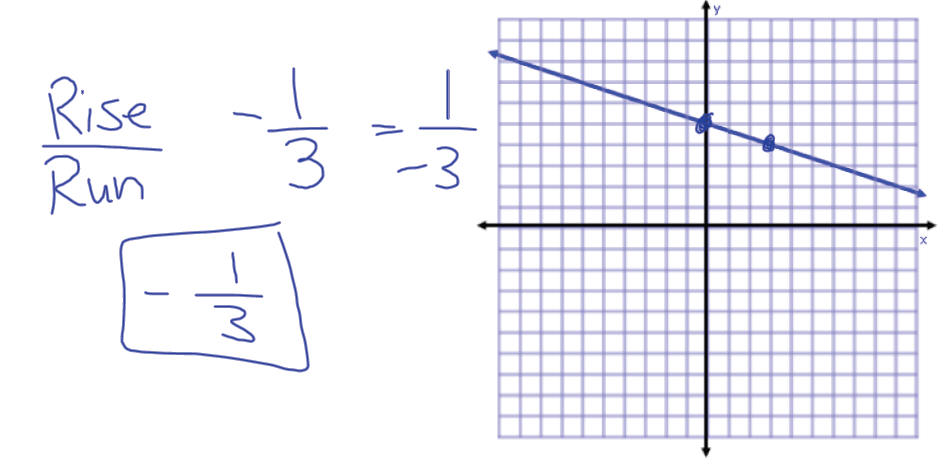
Example 2: Find the slope of the line.
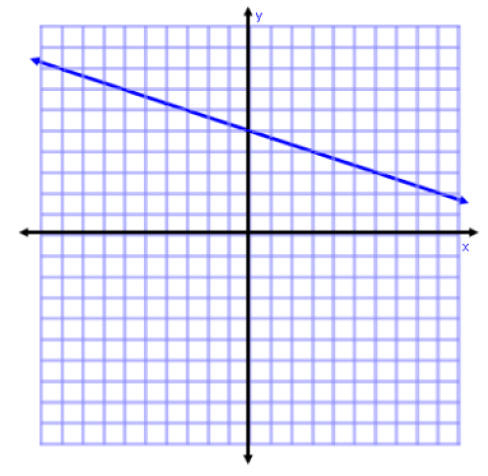
Practice 1:
1) Find the slope of the line.
2) Find the y-intercept
of the line.
3) Write the equation of the line .
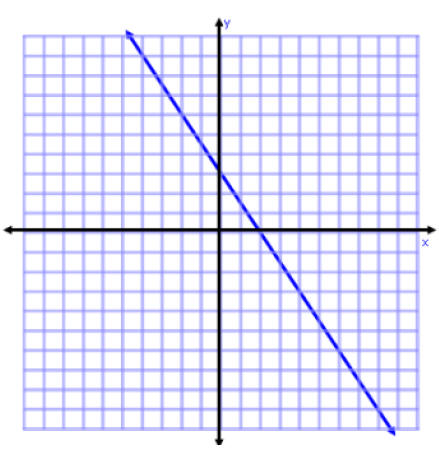
Practice 2:
1) Find the slope of the line.
2) Find the y-intercept
of the line.
3) Write the equation of the line.
Have a great day!
Homework #7 on
MathXL
•Blank Word Document.doc
•GraphsHowto.doc
•7.StudentNotes.pdf


