Purposes:
To examine the effects of parameters in the equation y = ax2 + bx + c.
We keep two parameters constant while varying the third, rotating through all
cases.
The constants which have been chosen are not important by themselves, and
neither
are the specific resulting patterns. What becomes noteworthy is the fact that
such
patterns do exist. This activity sheet will push students to practice graphing
parabolas ,
finding vertices, and create functions which join these vertices.
Prerequisites:
(1) Students should be familiar with quadratic functions and their graphs.
(2) Students should be able to find the vertex of a parabola by at least one
method.
(3) Students may wish to use linear and/or quadratic regression on their
calculator to find the
resulting patterns.
(4) The technique of completing the square will be useful to prove relationships
between vertices
that they have found.
Notes:
This activity will take some time and patience among students. Working in groups
and
sharing results will help alleviate these issues a great deal. Even so, students
will need
to be careful in their work. However, students usually realize fairly quickly
when a
vertex needs to be corrected, so this will not be a big problem. Students can
often find
the pattern, particularly if they resort to regression, but proving that is
another matter
entirely. Students should be encouraged to work on this with other students
first, but
going through this together in class will often be necessary to prove the
general case.
Technology is wonderful for showing these relationships. On a Texas Instruments
calculator, one can enter, for example, y1 = {-4, -2, 0, 2, 4}x2 + 4x + 6 to see
several
graphs at once. A nicer approach, if you have access to a computer, is to create
an
animation. Consider a simple program such as Graphing Calculator (Mac) or
WinPlot
(Windows) to do elegant animations easily. With more prerequisites for use , try
Mathematica, Maple or another computer algebra system . All of these can give a
dynamic
View of the effects of the parameters.
Mathematical Investigations
Quadratic Parameters
We want to consider the general quadratic function, f(x) = ax2 + bx + c, and
what happens to the
graph of the function as the parameters a, b, and c change. Specifically, let's
look at each
parameter in turn and how it affects where the vertex of the parabola lies . Work
together in
groups of 3 or 4. One person take the first, another the second, and so on.
Complete the square
to find vertices of the 12 parabolas and share your results to complete the
table:
1. Consider the quadratic function y = x2 + 4x + C.
Your goal is to determine how its is graph affected by changes in C .
a. For each of the following values of C , find the vertex of the parabola

(Work space to show your work completing the square on the
3 or 4 quadratic functions you did)
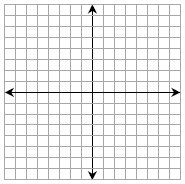
b. Plot the twelve pairs of vertex coordinates on a new
graph and derive the equation of the curve that
would best fit those points. This is the "locus" of
the vertices of the function y = x2 + 4x + C as C
varies. |
 |
c. Describe, using complete sentences, how changing
the parameter C affects the graph of the function
y = x2 + 4x + C. |
2. Consider the quadratic function y = x2 + Bx + 6.
Your goal is to determine how is its graph affected by changes in B.
a. For each of the following values of B, find the vertex of the parabola.
Again, divide
the work among 3 or 4 of you and record the group results on your paper.

(Work space to show your work completing the square on the
3 or 4 quadratic functions you did)
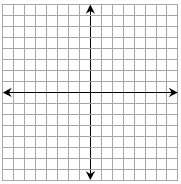
b. Plot the vertex coordinates on a new graph and find the
equation of the curve that would best fit those points.
This is the "locus" of the vertices of the function:
y = x2 + Bx + 6 as B varies.

c. Describe, using complete sentences, how changing the
parameter B affects the graph of the
function y = x2 + Bx + 6.
3. Finally, consider the quadratic function y = Ax2 + 4x +
6.
Your goal is to determine how is its graph affected by changes in A.
a. For each of the following values of A, find the vertex of the parabola. work
together
with your group to spread the work. It may be necessary to approximate
coordinates
in your graph.

(Work space to show your work completing the square on the
3 or 4 quadratic functions you did)
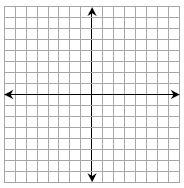
b. Plot the vertex coordinates on a new graph and find the
equation of the curve that would best fit those points.

c. Describe, using complete sentences, how changing the
parameter A affects the graph of the
function y = Ax2 + 4x + 6.


