Learning Objectives:
1. Graph quadratic functions of the form

2. Find the maximum or minimum value of a
quadratic function .
3. Model and solve optimization problems
involving quadratic functions .
1. Graphing: The Vertex
The Vertex of a Parabola
Any quadratic function f(x) = ax^2 + bx + c, a ≠ 0, will have vertex

The x- intercepts , if there are any, are found by solving
the quadratic equation

The x-intercepts, if there are any, are found by solving
the quadratic equation

Graphing a Quadratic Function Using Its Properties
Step 1: Determine whether the parabola opens up or
down.
Step 2: Determine the vertex and axis of symmetry.
Step 3: Determine the y-intercept, f(0).
Step 4: Determine the discriminant, b^2 – 4ac.
•If b^2 – 4ac > 0, then the parabola has two x -intercepts, which are
found by solving f(x) = 0.
•If b^2 – 4ac = 0, the vertex is the x -intercept.
•If b^2 – 4ac < 0, there are no x-intercepts.
Step 5: Plot the points. Use the axis of symmetry to find an additional
point. Draw the graph of the quadratic function.
Example:
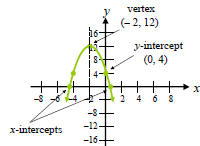
Graph f(x) = –2x^2 – 8x + 4 using its properties.


The graph of a quadratic function has a vertex at

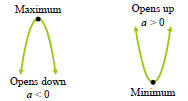
The vertex will be the highest point on the graph if a < 0
and  will be the maximum value of f.
The vertex will be the lowest point on the graph if a > 0
and  will be the minimum value of f.

2. Maximum and Minimum Values
Example:
Determine whether the quadratic function

has a maximum or minimum value. Find the value.
3. Applications Involving Maximization
Example:
The revenue received by a ski resort selling x daily ski lift passes is
given by the function R(x) = – 0.02x^2 + 24x. How many passes
must be sold to maximize the daily revenue?