Math Grade 8 Standards
Idaho Department of Education
Content Standards |
Objective |
Sub Objectives |
Task Analysis |
Essential Vocabulary |
Sample Assessment |
Resources |
| Standard 5: Data
Analysis, Probability, and Statistics |
| Goal 5.1: Understand data analysis |
8.M.5.1.1 Analyze and interpret
tables, charts, and graphs, including frequency tables, scatter plots,
broken line graphs , line plots, bar graphs, histograms, circle graphs ,
and stem-and-leaf plots.
CL: D, E
Calc: CR
Content Limit: Graphics may have at most ten data categories. Circle
graphs may have at most eight sectors. Scales are in increments
appropriate to the application. Histogram intervals must be consistent. |
• Analyze and interpret tables,
charts, and graphs, including frequency tables, scatter plots, broken
line graphs, line plots, bar graphs, histograms, circle graphs, and
stem-and-leaf plots |
• Discuss and identify the
correspondence between data sets and their graphical representations |
outlier • frequency table • histogram
• scatter plot • broken line graph • line plot • circle graph •
stem-and-leaf plot |
|
|
| |
8.M.5.1.2 Explain and justify
conclusions drawn from tables , charts, and graphs.
CL:
Calc:
Content Limit: Assessed in the classroom, not on the ISAT. |
• Explain and justify conclusions
drawn from tables, charts, and graphs |
• Identify the relationship between
data sets in tables, charts or graphs •
Determine and discuss any positive or negative correlation
• Support conclusions using mathematical reasoning |
positive/ negative correlation |
|
|
| 8.M.5.1.3 Use appropriate vocabulary
and notations.
CL:
Calc:
Content Limit: Assessed in the classroom, not on the ISAT. |
• Use appropriate vocabulary and
notations |
• Communicate using correct
mathematical terminology |
|
|
|
| Goal 5.2: Collect, organize, and
display data. |
8.M.5.2.1 Collect, organize, and
display data with appropriate notation in tables, charts, and graphs,
including scatter plots, broken line graphs, line plots, bar graphs,
histograms, and stem-and-leaf plots. CL: C
Calc: CN
Content Limit: Given data, choose a display. Displays limited to scatter
plots, broken line graphs, line plots, bar graphs, histograms, and
stem-and-leaf plots. ‘Collect’ to be assessed in classroom, not on the
ISAT. |
• Collect, organize, and display data
with appropriate notation in tables, charts, and graphs, including
scatter plots, broken line graphs, line plots, bar graphs, histograms,
and stem-and-leaf plots |
• Select appropriate graphical
representation for given data • Organize
data as needed to create visual displays
• Discuss benefits of various types of graphs
• Draw, label, and create selected graphical
representation for data |
|
|
|
| Goal 5.3: Apply simple statistical
measurements. |
8.M.5.3.1 Choose and calculate the
appropriate measure of central tendency – mean, median, and mode.
CL: C
Calc: YES
Content Limit: Items should be set in a real -world context. Items may
assess finding the range, mean, median, or mode of a set of data
presented in a chart, table, graph, or plot (e.g., scatter plot, line
plot, or stem-and-leaf plot). Items that assess understanding of these
concepts may ask students to draw conclusions from an analysis of range
and/or central tendency measures. Data set should include no more than
12 data points. Data set may have an even or an odd number of data
points and does not need to be in numeric order. No more than three
categories of information should be used in data sets. |
• Choose and calculate the
appropriate measure of central tendency – mean, median, mode and range |
• Calculate mean, median, mode and
range of data sets • Choose measure of
central tendency which best represents data |
mean • median • mode • range •
central tendency |
|
|
| |
8.M.5.3.2 Explain the
significance of distribution of data, including range, frequency, gaps,
and clusters. CL:
Calc:
Content Limit: Assessed in the classroom, not on the ISAT. |
• Explain the
significance of distribution of data, including range, frequency, gaps,
and clusters |
• Cite any trends which
appear in data • Analyze the significance of
these trends |
frequency • clusters •
distribution • gaps |
|
|
| Goal 5.4: Understand basic concepts
of probability. |
8.M.5.4.1 Model situations of
probability using simulations. CL:
Calc:
Content Limit: Assessed in the classroom, not on the ISAT. |
• Model situations of probability
using simulations |
• Perform experiments and simulations
and draw conclusions about probability |
probability •
experimental/theoretical • probability • event |
|
|
| |
8.M.5.4.2 Recognize equally likely
outcomes .
CL: C, D
Calc: CN
Content Limit: Items describe familiar situations such as spinning a
spinner, rolling one or two dice (does not include sum of two dice ), or
drawing different colored objects from a container. Equally likely
outcomes must pertain to the same event. |
• Recognize equally likely outcomes |
• Compare and predict outcomes of
common situations involving equally likely outcomes |
equally likely outcome • random |
|
|
| 8.M.5.4.3 Explain that probability
ranges from 0% to 100% and identify a situation as having high or low
probability .
CL:
Calc:
Content Limit: Assessed in the classroom, not on the ISAT. |
• Explain that probability ranges
from 0% to 100% and identify a situation as having high or low
probability |
• Compare fraction, percent & decimal
representations of probability • Recognize
and compare the range of possible outcomes |
|
|
|
| 8.M.5.4.4 Use the language of
probability.
CL:
Calc:
Content Limit: Assessed in the classroom, not on the ISAT. |
• Use the language of probability |
• Define probability terms |
• Take care in using chances versus
odds in probability • Favorable outcome |
|
|
| Goal 5.5: Make predictions or
decisions based on data. |
8.M.5.5.1 Make predictions based on
experimental and theoretical probabilities.
CL: D, E
Calc: YES
Content Limit: Items may include combinations of events (e.g., rolling a
number cube then spinning a spinner or drawing two cards without
replacement). Items may not include conditional probability. Items may
require comparison between experimental and theoretical probabilities. |
• Make predictions based on
experimental and theoretical probabilities |
• Distinguish between experimental
and theoretical probability • Calculate
theoretical probability
• Perform experiments, collect data, and find
experimental probability
• Predict future outcomes based on probabilities
• Calculate the probability of compound events
(with or without replacement) |
experimental/theoretical •
probability • simple/compound event • replacement |
|
|
| |
8.M.5.5.2 Conduct statistical
experiments and interpret results using tables, charts, or graphs.
CL:
Calc:
Content Limit: Assessed in the classroom, not on the ISAT. |
• Conduct statistical experiments and
interpret results using tables, charts, or graphs |
• Perform probability experiments
• Collect and organize data using tables, charts
or graphs
• Draw conclusions from the data |
|
|
|
| 8.M.5.5.3 Use appropriate vocabulary
and notations.
CL:
Calc:
Content Limit: Assessed in the classroom, not on the ISAT. |
• Use appropriate vocabulary and
notations |
• Communicate using correct
mathematical terminology |
|
|
|
Start solving your Algebra Problems
in next 5 minutes!
 |
 |
 |
|
Algebra Helper
Download (and optional CD)
Only $39.99
|
|
Click to Buy Now:
OR
|
|
|
 |
 |
 |
|
2Checkout.com is an authorized reseller
of goods provided by Sofmath
|
|
Attention: We are
currently running a special promotional offer
for Algebra-Answer.com visitors -- if you order
Algebra Helper by midnight of
December 27th
you will pay only $39.99
instead of our regular price of $74.99 -- this is $35 in
savings ! In order to take advantage of this
offer, you need to order by clicking on one of
the buttons on the left, not through our regular
order page.
If you order now you will also receive 30 minute live session from tutor.com for a 1$!
|
You Will Learn Algebra Better - Guaranteed!
Just take a look how incredibly simple Algebra Helper is:
Step 1
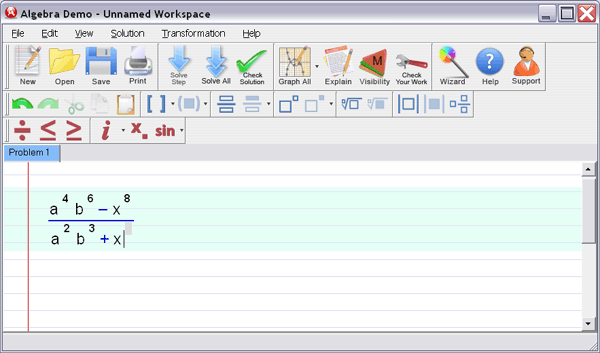
: Enter your homework problem in an easy WYSIWYG (What you see is what you get) algebra editor:

Step 2 :
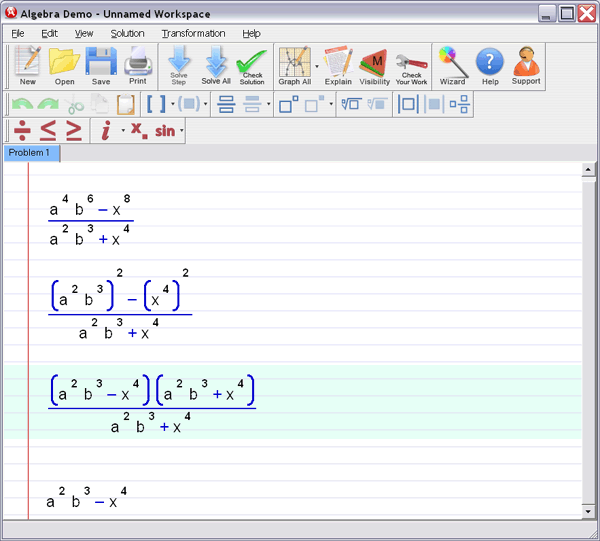
Let Algebra Helper solve it:

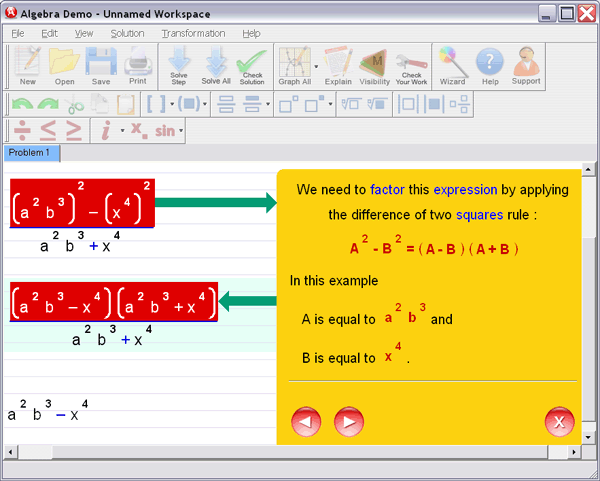
Step 3 : Ask for an explanation for the steps you don't understand:

Algebra Helper can solve problems in all the following areas:
- simplification of algebraic expressions (operations
with polynomials (simplifying, degree, synthetic division...), exponential expressions, fractions and roots
(radicals), absolute values)
- factoring and expanding expressions
- finding LCM and GCF
-
(simplifying, rationalizing complex denominators...)
- solving linear, quadratic and many other equations
and inequalities
(including basic logarithmic and exponential equations)
- solving a system of two and three linear equations
(including Cramer's rule)
- graphing curves (lines, parabolas, hyperbolas, circles,
ellipses, equation and inequality solutions)
- graphing general functions
- operations with functions (composition, inverse, range, domain...)
- simplifying logarithms
- basic geometry and trigonometry
(similarity, calculating trig functions, right triangle...)
- arithmetic and other pre-algebra topics
(ratios, proportions, measurements...)
ORDER NOW!
 |
 |
 |
|
Algebra Helper
Download (and optional CD)
Only $39.99
|
|
Click to Buy Now:
OR
|
|
|
 |
 |
 |
|
2Checkout.com is an authorized reseller
of goods provided by Sofmath
|
|
|
 |
| |
| "It
really helped me with my homework. I was
stuck on some problems and your software walked me
step by step through the process..." |
| C. Sievert, KY
| |
| |
 |
| |
Sofmath
19179 Blanco #105-234
San Antonio, TX 78258
|
Phone:
(512) 788-5675
Fax: (512) 519-1805
| | |


