This is an overview of the key ideas we have discussed during the first part of
this course.
You may find this summary useful as a study aid, but remember that the only way
to really
master the skills and understand the ideas is to practice solving problems .
The Addition Method (For Solving Systems of Linear Equations)
Write both equations in the form ax + by = c; multiply each equation by a
constant, if
necessary, so that the coefficients of one of the varibales are the same size;
then either add or
subtract the two equations in order to eliminate one of the variables; solve for
the remaining
variable ; then plug that value back into one of the original equations to solve
for the other
unknown .
Example: Solve the system of linear equations:
2x + 5y = 8
3x + 4y = 1
Solution: Begin by multiply the first equation by 3 and the second equation by
2, so that
the coefficients of x match up:
6x + 15y = 24
6x + 8y = 2
Then subtract the second eqution from the first to eliminate x :
7y = 22.
Hence
y =22/7.
Now we plug this into the original first equation to get

Therefore

Then we isolate x:
so 
therefore 
and consequently 
So the answers are 
Solving Absolute Value Equations
Example: Solve the equation |3x + 4| = 2.
Solution: Either
3x + 4 = 2 or 3x + 4 = −2
Hence
3x = −2 or 3x = −6
Therefore

The Point- Slope Formula for a Line
Example: Find the equation for a line through the points (2, 5) and (−3, 2).
Solution: First we find the slope:
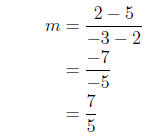
Now we plug this slope and either point into the formula y = y1 = m(x − x1)
to get

That is the equation for the line. If we need to, we can simplify and solve
for y:

so

Solving Quadratic Equations by Factoring
Example: Solve the equation x2 = 5x + 24 by factoring.
Solution: First, we need to move all the terms to one side of the equation, so
we subtract
5x from both sides, and we subtract 24 from both sides to get
x2 − 5x − 24 = 0
Now we factor the left side:
(x − 8)(x + 3) = 0
The only way this can be true is if one of the two factors is zero, so we see
taht either
x − 8 = 0 or x + 3 = 0
Consequently,

Solving Quadratic Equations by Completing the Square
Example: Solve the equation 3x2 = 10x + 6 by completing the square.
Solution: We need to get all the terms with x or x2 on the same side, so we
subtract 10x
from both sides:
3x2 − 10x = 6
We also need the coefficient of x to be 1, so we divide both sides of the
equation by 3:

Now we complete the square: the coefficient of x on the left side is
 ;
half of this is −5/3 ;the square of −5/3 is 25/9 , so that’s what we need to add
to both sides:

Since 2 = 18/9 , we can write this as

Now we factor the left side:

Then take square roots of both sides:

Therefore

Hence either

so

Function Notation
Example: Suppose that a function is given by the formula f(x) = x2 − 2x. Find
f(2) and
f(−3).
Solution: We evaluate the function by plugging the appropriate value in for x
and simpli-
fying:

Similarly,

So we have

Example: Find a formula for a linear function f(x) that satisfies f(2) = 7
and f(4) = −1.
Solution: First we find an equation for a line that passes through the points
(2, 7) and
(4,−1) – we can so this using the point-slope formula:
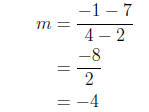
Therefore
y − (−1) = −4(x − 4)
so
y + 1 = −4x + 16
Therefore
y = −4x + 15
Now we replace the y with f(x) to obtain function notation:

TI-84 Calculator Reference Guide - Entering and Using Data
Tables
ENTERING LISTS
Most statistical calculations involve working with tables of data, so we need
to be able to input such tables into the graphing calculator . In the following
example, we will enter the data in the table at right. The same data will be
used in the later examples in this guide.
| x |
2 |
3 |
7.2 |
8.1 |
108 |
| y |
5 |
8 |
9 |
9 |
|
1. Select the STAT menu by
pressing:

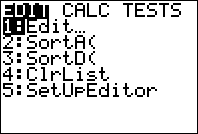
2. Select the first item in order to
edit the calculator’s lists:

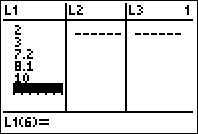
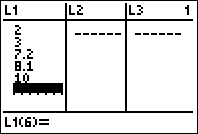
3. Enter the x-values in the first
column, labeled L1, as follows:

4. Use the right arrow key to move
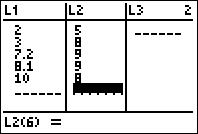
the cursor to the first row of the
second column (labeled L2); then
enter the y-values as follows:

SCATTERPLOTS
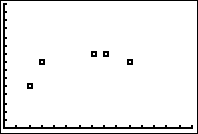
You can plot individual points on an xy-plane by performing a scatterplot.
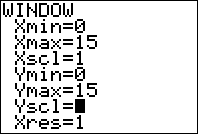
1. First, set the window as you
would when graphing a function.
To got to the menu for this,
press:

2. Go to the STAT PLOT menu by
pressing:

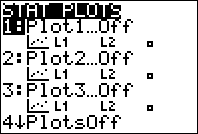
3. Select the first plot by pressing 1
or enter :


4. Select On by pressing enter:

5. View your plot by pressing:

REGRESSIONS
You can fit a line or curve to a set of data points by performing a regression
with the
graphing calculator. In this example, we find a line of best fit using a linear
regression.
1. Go to the STAT menu by
pressing:

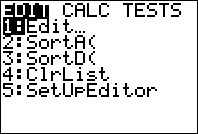
2. Use the right arrow key to select
the CALC menu:

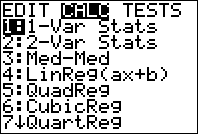
3. Select LinReg(ax+b) to perform a
linear regression on the data in
lists L1 (for x-values) and L2(for
y-values):

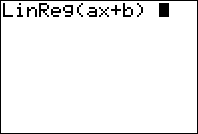
4. Calculate the coefficient for the
regression by pressing:

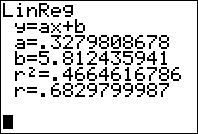
5. The resulting screen gives you
the coefficients for the
regression, as well as the
correlation coefficient r and its
square.


